



We are pleased to present to you our Investment Review for the first quarter of 2024. This review serves as an opportunity for us to provide you with insights into the performance of major asset classes and the broader market landscape.
We look forward to seeing you during the quarter and please feel free to contact me if you have any questions.
Your financial success remains our top priority, and we are dedicated to helping you achieve your long-term objectives.
“It takes less time to do the right thing than to explain why you did it wrong.” – Henry Wadsworth Longfellow.
EQUITY REVIEW
Global equities had a bumper first quarter, with US equities leading the way thanks in large part to the mega cap technology companies which continue to reap the benefits from the AI boom, providing significant tailwinds. A fund manager survey by Bank of America indicated that allocation to US equities is now at the highest level since November 2021. This is representative of the stellar performance increasing concentration in portfolios to historically high levels. South African equities faced challenges, persistently falling behind their global counterparts when measured in hard currency. Political uncertainty, macroeconomic headwinds, and infrastructure concerns collectively contribute to a challenging operational landscape for South African companies.
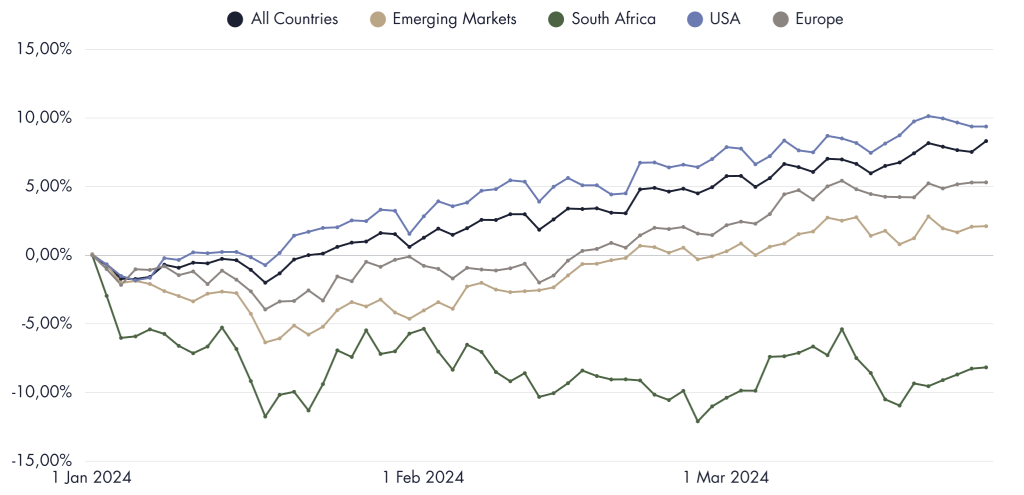
Source: Lipper. Data as at 31 March 2024.
HIGHLY VALUABLE SALES
The below graph illustrates the Price to Sales ratio of the S&P 500 over the past eighty years. Following the significant rally over the past 18 months the Price to Sales ratio of the S&P 500 has climbed to 2.71, near its historical high of 3.01. However, the main cause for concern is the Information Technology sector of the S&P 500 whose Price to Sales ratio is currently at a staggering 8.09, which is nearly three times the historical high of the S&P 500. This indicates that investors are happy to pay a premium for sales because of elevated profit margins, and because of narratives and perceptions that sales will surge higher evermore. Given the AI boom this is not surprising, however the question now is, is this the new normal or will there be a reversion to the mean? The crux lies in whether the technology giants can flawlessly deliver on the anticipated growth priced into their valuations.
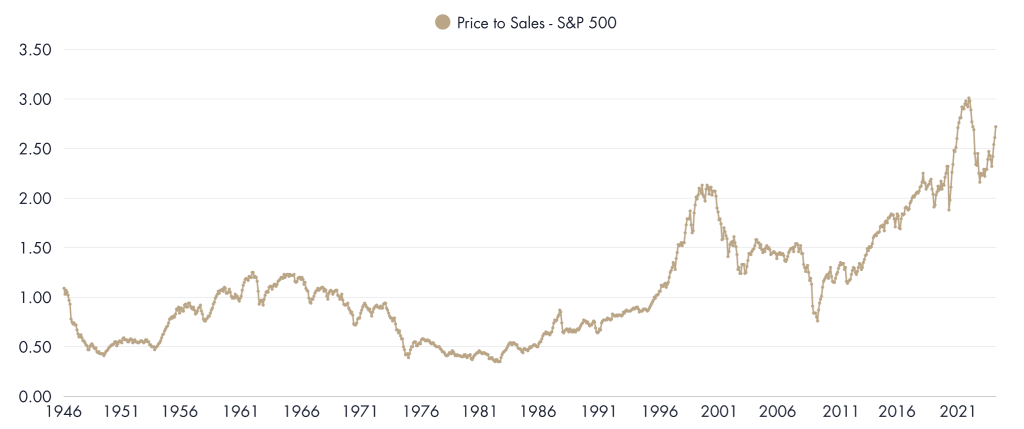
Source: FRED. Data as at 31 March 2024.
OPPORTUNITIES ARISE

Source: Lipper. Data as at 31 March 2024.
The Price to Earnings (P/E) ratio is used to evaluate the relative valuation of a company’s shares by comparing its current market price per share to its earnings per share. The graph below represents how much each region’s current P/E ratio differs from its 20 year average and the notable surge in American equities has led to a spike in valuations, with the current P/E ratio standing at 23.94, surpassing its 20 year average of 15.93 by more than 50%. In contrast, the P/E ratios of Emerging and Frontier Markets hover only slightly above and below their historical averages, indicating a relative value proposition in these regions for prudent investors. This underscores the significance of investors adopting a global perspective in their investment approach, as regions can experience largely sentiment driven over or undervaluation, presenting opportunities for astute investors to create value.
FIXED INCOME REVIEW
Global Fixed Income markets largely struggled over the first quarter of 2024. The increased stickiness of inflation over recent months lead the market to once again temper expectations for rate cuts. Yield increases were largely contained to the intermediate and long end of the yield curve. The Bloomberg Global Aggregate Bond and Bloomberg Global Treasury indexes each gave up 2.1% and 2.9% respectively. Corporate credit spreads tightened over the course of the quarter and given their lower sensitivity to interest rates the Bloomberg Global High Yield Index gained 2.1% over the first three months of 2024.

Source: Lipper. Data as at 31 March 2024.
NARROW CREDIT SPREADS – JUSTIFIED?
The following graph illustrates the average US corporate bond credit spread spanning the past 25 years. Notably, as indicated by the solid brown line, instances of spreads being this narrow have been scarce, with the current spread of 86 basis points notably lower than the long-term average of 152 basis points (as depicted by the dashed line) and only slightly above the historical low of 80 basis points reached in 2007. However, the relatively minimal premium currently associated with credit risk becomes less concerning when one considers the robust performance exhibited by the American economy. A notable 78.5% of companies in the S&P 500 recently reported quarterly results that exceeded analyst expectations, a figure significantly surpassing the long-term average of 66%. Furthermore, the US economy experienced an annualised growth rate of 3.3% in the fourth quarter of 2023, far exceeding earlier forecasts of a 2% increase.
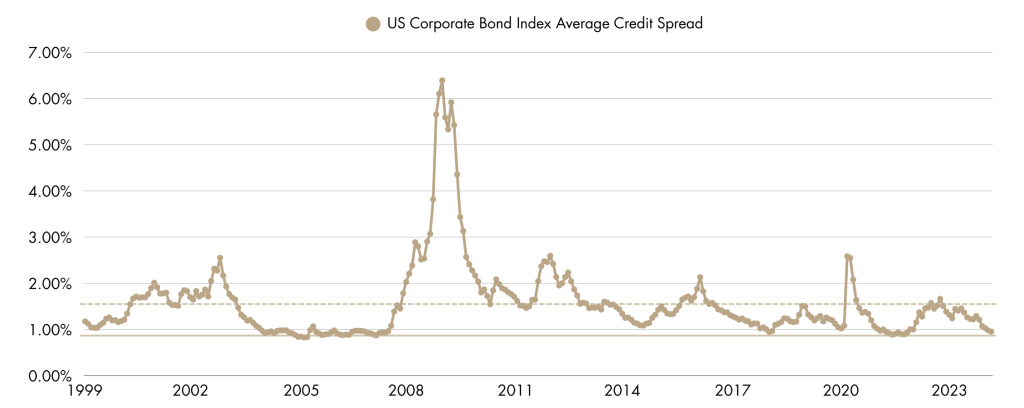
Source: FRED. Data as at 31 March 2024.
SOUTH AFRICA – CAUGHT BETWEEN A ROCK & A HARD PLACE
Inflation in South Africa continued to shift upwards, with the annual rate of inflation increasing from 5.1% in December to 5.6% in March. Consequently, as reflected in the graph below, treasury yields increased, as expectations for interest rate cuts and a pivot in interest rate policy shifted outwards. The macroeconomic environment in South Africa remains tentative, with stubborn inflation currently inhibiting the Reserve Bank from providing some much needed stimulus, as economic growth remains bleak, only managing 0.6% over the course of 2023. However, there may be some literal light at the end of preverbal tunnel with power cuts expected to ease gradually over the coming years and the easing of supply disruptions alleviating some of the pressure on the beleaguered South African economy.
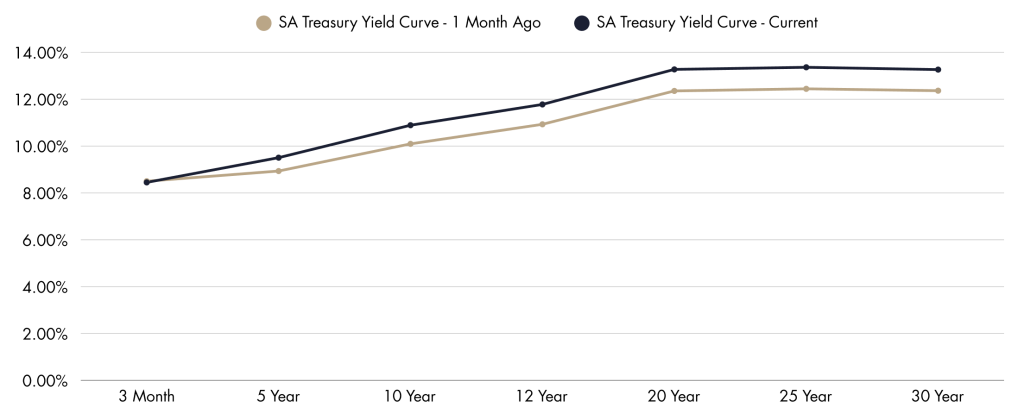
Source: FRED. Data as at 31 March 2024.
REAL ESTATE REVIEW
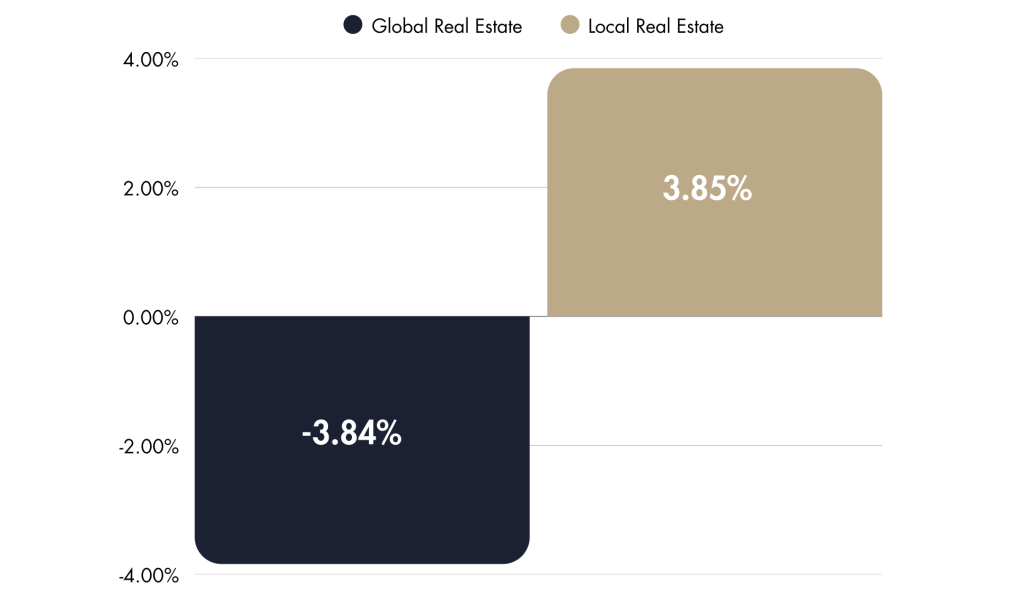
The current macroeconomic environment continues to prove unfavourable for global Real Estate with the asset class losing 3.84% over the first three months of 2024.
Sticky inflation, postponing interest cuts further suppressed valuations. However, inflation has moderated significantly and although it is proving more stubborn than originally anticipated, interest rates have peaked and the inevitable downward shift will provide a strong tailwind for this asset class.
In spite of the relatively bleak macroeconomic situation in South Africa, Real Estate had a relatively strong start to the year gaining nearly 4% over the first quarter of 2024.
Source: Lipper. Data as at 31 March 2024.
CURRENCY REVIEW
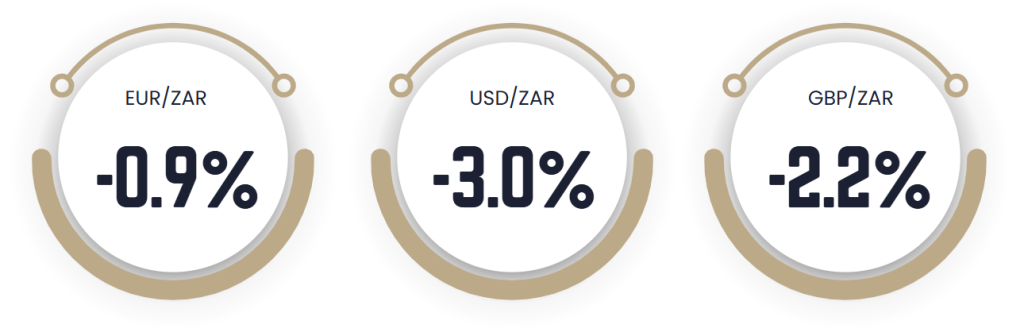
The South African Rand depreciated against the majority of major currencies, encountering notable pressure amid uncertainties stemming from both the global economic landscape and domestic issues.
Source: FRED. Data as at 31 March 2024.
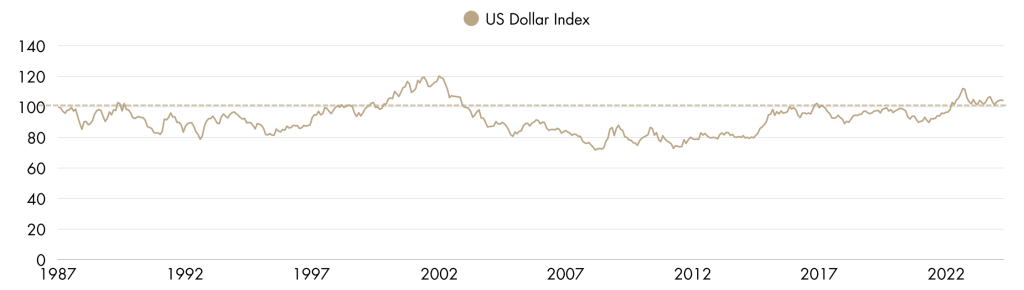
The US Dollar Index is a measure of the US Dollar relative to a basket of foreign currencies including the Euro; Japanese Yen; Canadian Dollar; British Pound; Swedish krona; and Swiss Franc. As indicated by the dashed line below, there have been only a few occasions in the past almost four decades when the US Dollar has exhibited such strength. The appreciation of the US Dollar has been propelled by risk-off sentiment due to macroeconomic uncertainty and high interest rates. Now, the looming question is whether the US Dollar will sustain its upward trajectory or revert to the mean.
Source: FRED. Data as at 31 March 2024.
GLOSSARY & DISCLOSURES
Equity
USA – Represented by the the MSCI USA Index which is designed to measure the performance of the large and mid cap segments of the US market, with 610 constituents. South Africa – Represented by the MSCI South Africa Index which is designed to measure the performance of the large and mid cap segments of the South African market, with 32 constituents. All Countries – Represented by the MSCI All Country World Index which captures large and mid cap representation across 23 Developed Markets and 24 Emerging Markets countries, with 2,920 constituents. Emerging Markets – Represented by the MSCI Emerging Markets Index which captures large and mid cap representation across 24 Emerging Markets countries, with 1,440 constituents. Europe – Represented by the MSCI Europe Index captures large and mid cap representation across 15 Developed Markets countries in Europe, with 421 constituents.
Fixed Income
Global Aggregate – Represented by the Bloomberg Global Aggregate Index which measures the performance of global investment grade debt from twenty-eight local currency markets. This multi-currency benchmark includes treasury, government-related, corporate and securitized fixed-rate bonds from both developed and emerging markets issuers. Global Treasury – Represented by the Bloomberg Global Aggregate Index which measures fixed-rate, local currency government debt of investment grade countries, including both developed and emerging markets. The index represents the treasury sector of the Global Aggregate Index. Global High Yield – Represented by the Bloomberg Global High Yield Index measures the performance of the global high yield debt market.
Real Estate
Local – Represented by the JSE All Property Index which measures the performance of the South African listed property sector. Global – represented by the FTSE EPRA/NAREIT Developed Index which measures the performance of eligible real estate equities worldwide.
All returns are cumulative and measured in United State Dollars apart from the JSE Local Property which is measured in South African Rand. Information in this document regarding market or economic trends, or the factors influencing historical or future performance, reflects the opinions of management as of the date of this document. These statements should not be relied upon for any other purpose. Past performance is no guarantee of future results, and there is no guarantee that the market forecasts discussed will be realised.
