



The first quarter of 2025 was marked by diverging asset class performances, heightened volatility, and shifting macroeconomic narratives. While global fixed income markets delivered strong returns, equity markets faced a turbulent March, largely due to renewed policy uncertainty out of the U.S.
A key catalyst for the late-quarter market swings was Donald Trump’s proposed tariff policies, which triggered sharp corrections in developed market equities, a flight to quality in fixed income, and renewed risk aversion in global markets. These tariffs, aimed at reshaping trade relations and protecting U.S. industries, instead sparked concerns over higher costs, corporate margin compression, and retaliatory measures from key trading partners.
While volatility remains an inherent part of investing, Bellamont remains steadfast in its belief that high-quality, globally diversified portfolios are best positioned to navigate short-term noise and deliver superior long-term returns.
Our quarterly commentary examines recent tariff developments and reviews the performance of key asset classes over the first quarter of 2025.
Trump’s 2025 Tariffs: Implications for Investors
The recent reintroduction and expansion of trade tariffs by the U.S. administration under President Trump have once again raised concerns about global markets. While these policies make for dramatic headlines, it is crucial to separate sentiment from reality.
History has shown that well-run, high-quality businesses and by extension, well-structured investment portfolios are resilient to these types of disruptions. Bellamont’s philosophy remains unchanged: short-term noise does not derail long-term wealth creation.
1. Breakdown of the Tariffs
As of 3 April 2025, U.S. President Donald Trump has implemented a series of tariffs aimed at reducing trade deficits and supporting domestic industries. Notably, during the “Liberation Day” event on 2 April 2025, he announced additional trade measures.
Below is a summary of the most notable tariffs, particularly those impacting key economies.
1. Implemented Tariffs
a. Global Baseline Tariff
All Countries: A 10% universal tariff on all imports, effective 5 April 2025.
b. Notable Country-Specific Tariffs
- China: 54% total tariff (previously 20%, increased by 34%), effective 9 April 2025.
- Vietnam: 46% tariff on imports.
- Taiwan: 32% tariff on imports.
- India: 26% tariff on imports.
- European Union: 20% tariff on imports.
- Japan: 24% tariff on imports.
- Canada & Mexico: 25% tariff on non-compliant goods, including foreign-made cars and parts.
- South Africa: 30% tariff on South African goods entering the U.S., effective 9 April 2025.
c. Sector-Specific Tariffs
- Automobiles: 25% tariff on all imported vehicles, effective 2 April 2025.
- Steel & Aluminium: 25% tariff on all imports, effective 12 March 2025.
2. Threatened Tariffs
- Pharmaceuticals & Semiconductors: Potential 25% tariff (announced 18 February 2025).
- Lumber, Timber & Derivatives: 25% tariff under consideration (announced 3 March 2025).
- Copper: Proposed 25% tariff (announced 25 February 2025).
3. International Reactions
- China: Announced retaliatory tariffs, including a 15% tariff on U.S. liquefied natural gas and coal, and a 10% tariff on crude oil, pickup trucks, agricultural machinery, and large-displacement cars, effective 10 February 2025.
- European Union: EU President Ursula von der Leyen signalled potential countermeasures in response to U.S. tariffs.
- Canada: Prime Minister Mark Carney, who took office on 14 March 2025, has criticised the tariffs and is considering retaliatory actions to support Canada’s auto sector.
- Australia: 10% tariff on Australian exports to the U.S., effective 5 April 2025. Prime Minister Anthony Albanese has strongly opposed the measure, calling it “illogical and harmful.”
- South Africa: The South African government has expressed concerns over the economic impact of the 30% U.S. tariff but has not yet announced a reciprocal tariff. Officials are reportedly evaluating potential responses to mitigate the impact on trade and investment.
These developments have introduced uncertainty into global markets, with concerns about rising costs for consumers and the potential disruption of international trade relationships.
2. The Economics Behind Tariffs
While these tariffs are positioned as a way to protect American industries, the reality is that tariffs function as a tax on imports, which ultimately increases costs for American consumers and businesses.
a. Who Actually Pays?
Although the tariffs are imposed on foreign goods, it is U.S. consumers and businesses that bear most of the costs:
- Higher prices for consumers – U.S. businesses importing goods must either absorb the cost or pass it on to consumers, leading to inflationary pressures.
- Rising input costs for U.S. manufacturers – Many American companies rely on imported raw materials (such as steel and electronics components). Higher costs make American-made products less competitive.
- Supply chain disruptions – Companies dependent on global trade are adjusting, which introduces short-term inefficiencies but ultimately leads to more resilient supply chains.
b. The Long-Term Market Response
Historically, trade disputes have led to short-term market volatility but have not derailed long-term economic growth or investment returns. The 2018–2019 U.S.–China trade war, for instance, caused temporary equity market disruptions, yet within a year, markets had adjusted, and businesses had found ways to offset cost pressures.
The Smoot-Hawley Tariff Act of 1930 widely blamed for worsening the Great Depression took place in a vastly different economic environment. Unlike that era, today’s markets are far more dynamic, diversified, and globalised, allowing businesses to adapt more effectively. Well-managed companies respond by adjusting pricing models, improving efficiencies, and diversifying suppliers ensuring long-term profitability remains intact.
U.S. Historical Average Import Tariff Rates Dating Back to 1821
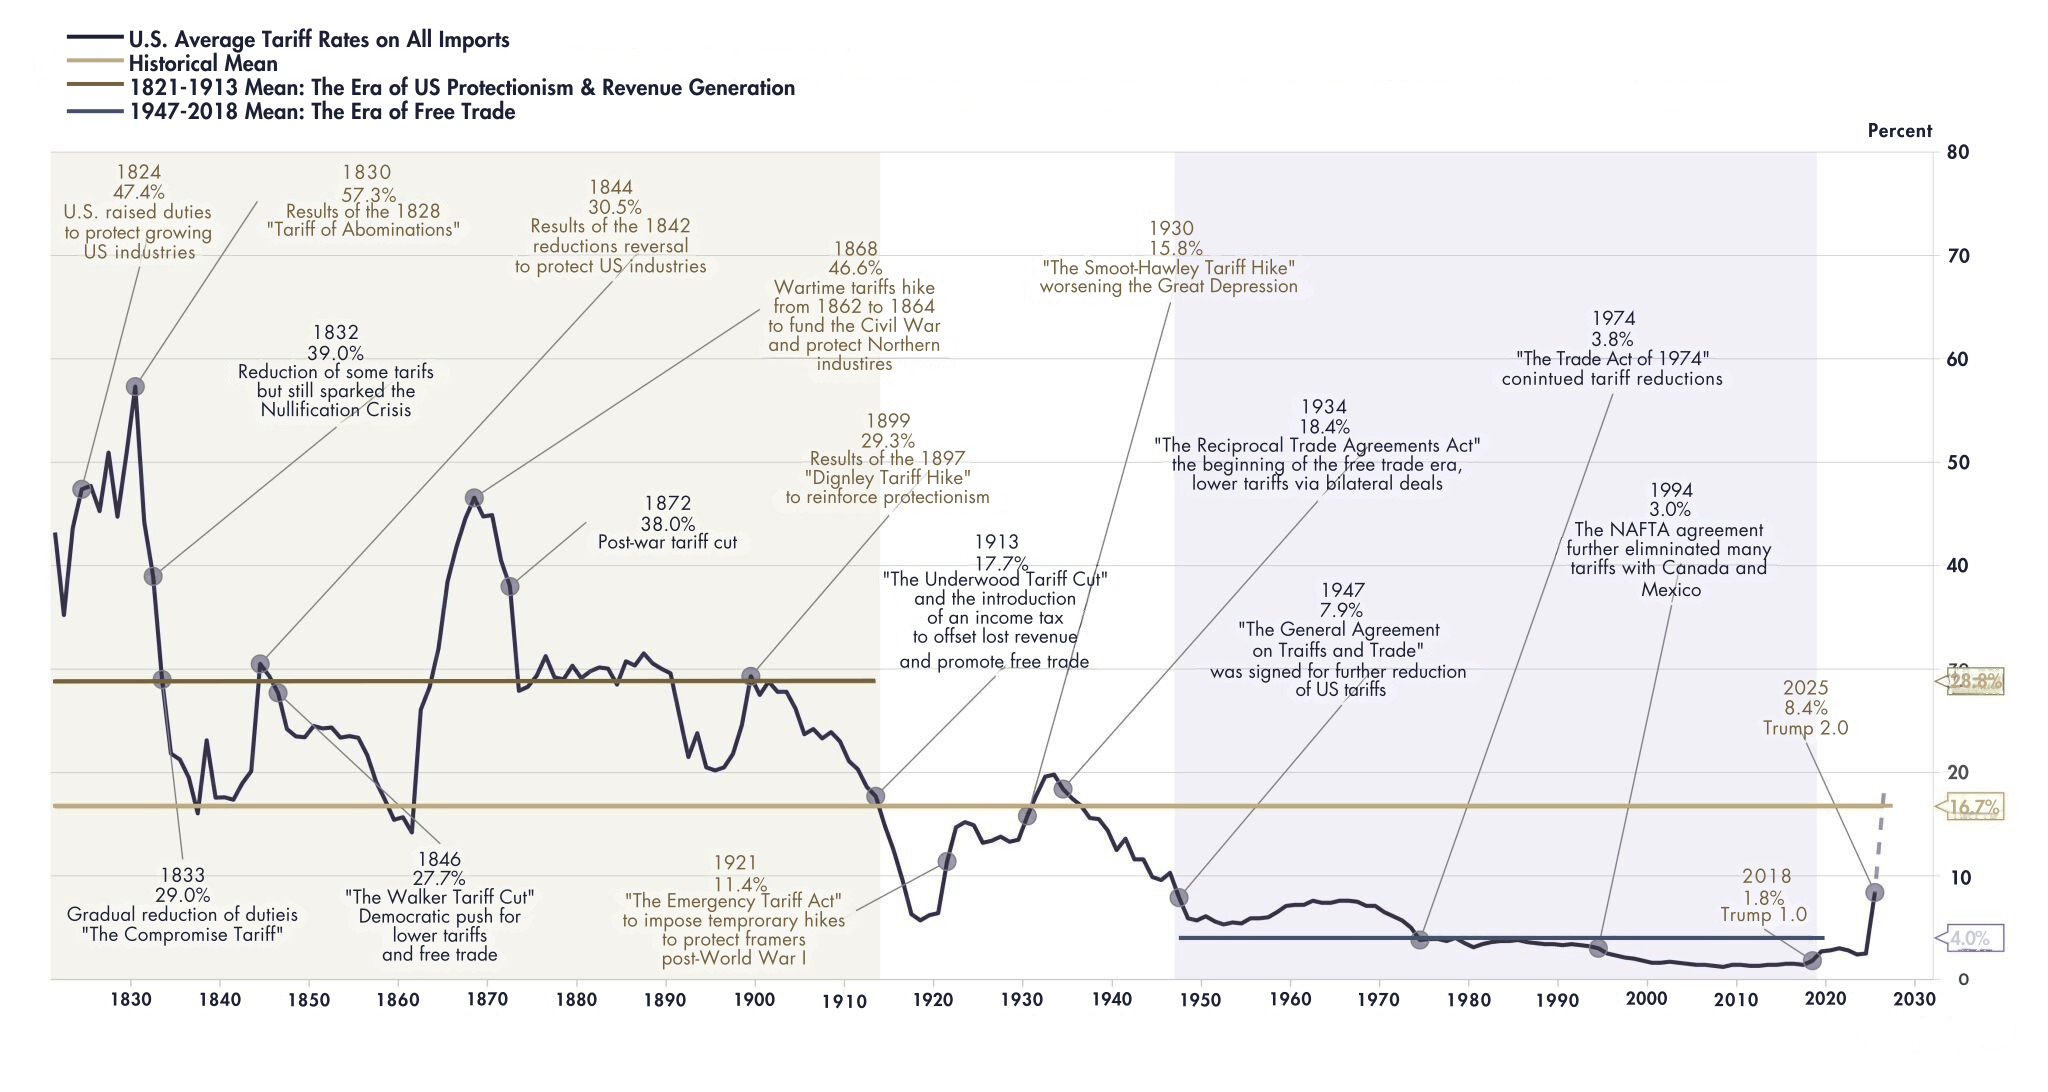
Source: Macrobond. Data as 31 March 2025.
Perspective is key. Over the past two centuries, U.S. tariff rates have fluctuated significantly, yet the past 70 years have been an era of historically low tariffs, often resembling near-free trade. The data shows that tariffs are not a new phenomenon; they have been a recurring feature of global trade policy. Even with the proposed tariff increases under Trump’s policies, the average tariff level would merely return to historical norms rather than reach unprecedented highs. While markets will adjust in the short term, this shift is not an existential threat and should be viewed in the broader historical context.
3. Implications for Global Markets
a. Short-Term Disruptions
Certain sectors are feeling the immediate impact of tariffs:
- Industrials and Automobiles – Higher input costs and supply chain shifts are creating temporary pricing pressures.
- Commodities and Emerging Markets – Some pressure on commodity prices is evident, though diversification of supply chains is already underway.
- Technology Sector – Tariffs on Chinese-made components have led to some volatility, but leading tech firms have strong pricing power to adjust.
b. Long-Term Stability and Adaptability
Despite these disruptions, the broader market remains resilient:
- Trade adjustments happen faster today than in previous tariff cycles, meaning disruptions are absorbed more efficiently.
- Companies with strong balance sheets and pricing power can adjust more easily, ensuring continued profitability.
- The underlying strength of the global economy remains intact, as businesses continue to find ways to navigate policy shifts.
4. What This Means for Your Portfolio
At Bellamont, we remain committed to quality investing, which inherently mitigates exposure to geopolitical turbulence. Here’s why our portfolios remain well-positioned:
- Limited Direct Exposure – We prioritise businesses with global revenue streams, strong pricing power, and adaptive supply chains. These companies are built to withstand and even benefit from shifts in global trade.
- Diversification as a Strength – By spreading exposure across sectors and geographies, no single macroeconomic event such as U.S. tariffs can significantly impact long-term returns.
- Focus on Fundamentals, Not Headlines – While markets may react to uncertainty, history has shown that well-run companies with competitive advantages regain footing quickly.
5. The Bigger Picture: Staying the Course
While tariffs may cause short-term fluctuations, they do not alter the core principles of compounding wealth over time. The greatest risk to long-term investing is not external events, but emotional reactions to them. History has shown that markets recalibrate, businesses adapt, and well-structured portfolios continue to grow.
At Bellamont, we remain vigilant but measured. We do not react impulsively to news cycles. We focus on quality, resilience, and the long-term growth of your capital.
FIXED INCOME COMMENTARY
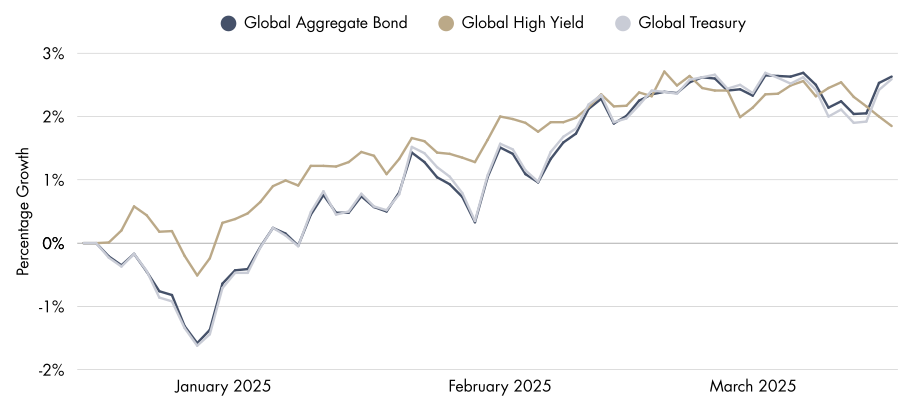
Fixed income markets delivered solid returns over the first quarter, supported by declining inflation, evolving interest rate expectations, and a rotation towards high-quality bonds in March.
Source: Lipper. Data as at 31 March 2025.
Bloomberg Global Aggregate Index: +2.63% – Investment-grade bonds performed well as central banks signalled a gradual easing cycle later in the year.
Bloomberg Global Treasury Index: +2.59% – Sovereign bonds remained a key beneficiary of increased demand for high-quality yield, particularly as equity markets turned volatile in March.
Bloomberg Global High Yield Index: +1.85% – High-yield debt posted more modest gains, reflecting selective investor risk appetite in the face of shifting credit conditions.
Monetary policy remained a key driver of fixed income performance. The U.S. Federal Reserve and European Central Bank maintained a cautious but data-dependent stance, with markets pricing in potential rate cuts later in 2025. The Fed kept rates at restrictive levels but softened its language on future hikes, offering relief to longer-duration bonds. Meanwhile, the ECB acknowledged slowing European growth, reinforcing expectations for a more flexible policy outlook. In emerging markets, local currency debt markets stabilised as inflationary pressures continued to ease.
Although inflation remains above pre-pandemic levels, it has continued its gradual decline. However, Trump’s tariff announcements in March introduced new inflationary risks, as higher import costs could filter through global supply chains. This contributed to a flight to quality, with investors rotating out of equities and into sovereign bonds. Investment-grade fixed income provided critical stability during the market volatility, reinforcing its role as a defensive anchor in uncertain periods.
EQUITY MARKET COMMENTARY
Global equity markets saw significant divergence, with emerging markets and South African equities outperforming, while developed markets struggled with shifting rate expectations and trade policy uncertainty.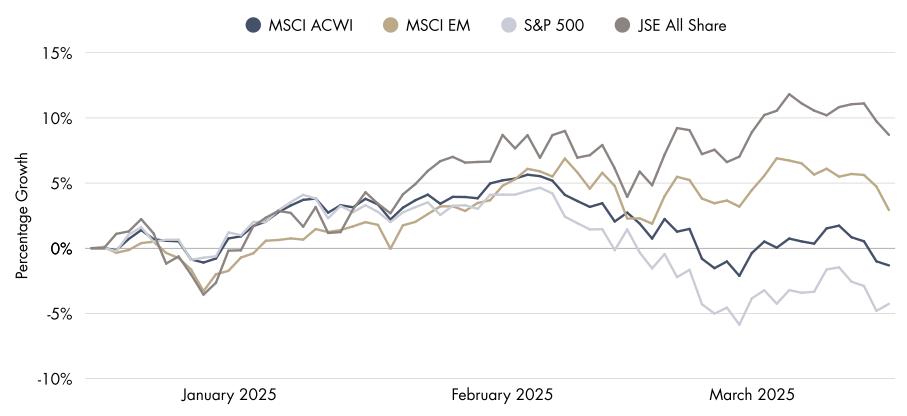
Source: Lipper. Data as 31 March 2025.
MSCI All Country World Index: -1.32% – Global equities posted modest declines, largely dragged down by developed markets.
S&P 500: -4.27% – The U.S. equity market experienced a sharp pullback, with technology and cyclical sectors particularly hard hit.
FTSE JSE All Share Index: +8.70% – South African equities rallied on commodity strength and selective buying in domestic stocks.
MSCI Emerging Markets Index: +2.93% – Emerging markets outperformed, buoyed by China’s policy support and selective capital inflows.
Trade policy uncertainty dominated in March, following tariff announcements from U.S. President Donald Trump. U.S. equities sold off as investors priced in higher import costs, weaker corporate earnings, and the risk of retaliatory measures from major trading partners. Sectors most exposed to global trade, including technology and industrials, saw heavy selling. In contrast, emerging markets proved more resilient, with China’s policy measures helping to offset broader concerns.
Interest rate expectations played a significant role in sector performance. With markets now anticipating rate cuts later in the year, sector leadership shifted. Defensive industries such as healthcare, consumer staples, and utilities held up well as investors sought stability. In contrast, technology and high-growth stocks declined as tighter financial conditions weighed on valuations. The so-called “Magnificent Seven” technology stocks, which had led markets higher in 2023 and 2024, came under pressure as stretched valuations met renewed macroeconomic uncertainty. Meanwhile, energy and commodities benefited from renewed strength, supporting markets like South Africa and Brazil.
South African equities were among the best performers globally. The FTSE JSE All Share Index’s 8.70% gain was largely driven by rising gold and platinum group metal (PGM) prices, which supported the mining sector. Select domestic stocks also attracted investor interest, as valuations remained compelling amid broader market uncertainty.
The South African rand strengthened over the quarter. After reaching a high of approximately 19.22 against the U.S. dollar in mid-January, it appreciated to around 18.00 by mid-March. This was supported by surging gold prices and optimism over potential budget agreements between the Democratic Alliance (DA) and the African National Congress (ANC). However, ongoing budget negotiations and political developments introduced volatility, with the rand trading at 18.36 against the dollar by early April.
Bellamont’s active approach proved well-positioned to navigate the shifting market environment. The “Magnificent Seven” technology stocks, which have been the primary driver of index and passive returns in recent years, collectively came under pressure, exposing the vulnerabilities of broad market trackers. In contrast, active strategies benefited from selective positioning, with defensive allocations and quality businesses demonstrating resilience. This highlights the importance of a nuanced investment approach in periods of market transition, where disciplined stock selection and risk management can add significant value.
REAL ESTATE MARKET COMMENTARY
The global real estate market delivered modest gains over the first quarter, supported by resilient demand and stabilising interest rate expectations. However, South Africa’s listed property market struggled, with stocks underperforming due to macroeconomic pressures and rising structural challenges.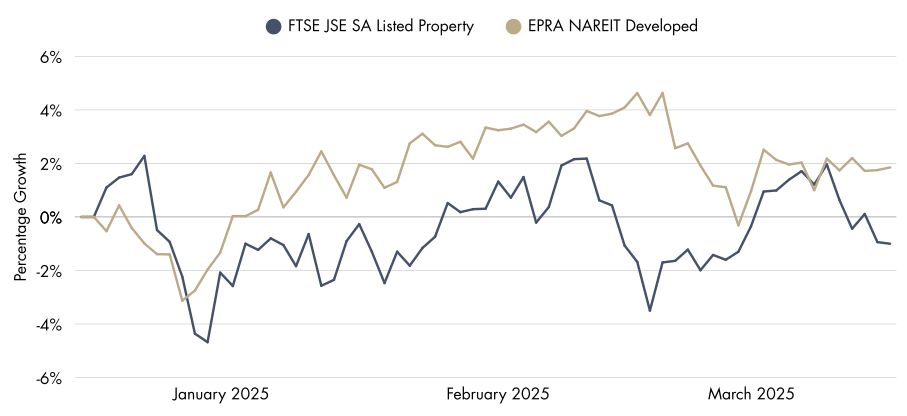
Source: Lipper. Data as at 31 March 2025.
FTSE EPRA Nareit Developed Index: +1.85% – Developed market real estate posted positive returns, benefitting from declining inflation, stabilising bond yields, and continued strength in logistics and data centres.
FTSE/JSE SA Listed Property Index: -1.00% – South African listed property declined, pressured by weak economic growth and rising municipal costs impacting rental yields.
Global real estate markets stabilised in the first quarter as central banks signalled a more measured approach to monetary policy, with investors pricing in potential rate cuts later in 2025. In developed markets, moderating inflation and softening central bank rhetoric provided support for real estate assets.
Meanwhile, South Africa’s property market remained under pressure due to weak domestic economic conditions and a high-interest-rate environment, which constrained both investor appetite and affordability for tenants. Despite improved commodity prices, South Africa’s property market faced ongoing economic difficulties and deteriorating municipal infrastructure in key metropolitan areas. Rising operational costs, including electricity and municipal rates, placed pressure on landlords, limiting their ability to pass on rental escalations.
CONCLUSION
The first quarter of 2025 underscored the complexity of navigating an evolving investment landscape. While global markets adjusted to shifting monetary policy expectations and renewed trade tensions, high-quality assets particularly in defensive sectors such as fixed income, real estate, and select equities demonstrated resilience.
At Bellamont, we remain focused on long-term value creation through disciplined investment selection. We continue to prioritise companies and assets with strong fundamentals, durable cash flows, and the ability to adapt to an evolving macroeconomic environment. As uncertainty persists, our commitment to high-quality, globally diversified portfolios remains the cornerstone of our approach ensuring resilience in volatile times and positioning for sustainable long-term returns.
GLOSSARY & DISCLOSURES
Equity
United States – Is represented by the S&P 500 which is an equity market index that measures the share price performance of the 500 largest companies in the United States. South Africa – Is represented by the JSE All Share – The All Share Index represents 99% of the value of all eligible securities listed on the Main Board of the Johannesburg Stock Exchange. Aims to represent the performance of the South African equity market. All Countries – Is represented by the MSCI All Country World Index – Captures large and mid cap representation across 23 Developed Markets and 24 Emerging Markets countries. With 2,920 constituents, the index covers approximately 85% of the global investable equity opportunity set. Emerging Markets – Is represented by the MSCI Emerging Markets Index – Captures large and mid cap representation across 24 Emerging Markets countries. With 1,440 constituents, the index covers approximately 85% of the free float-adjusted market capitalization in each country. Developed Markets – Is represented by the MSCI World Index – The MSCI World Index captures large and mid-cap representation across 23 Developed Markets (DM) countries. With 1,395 constituents, the index covers approximately 85% of the free float-adjusted market capitalization in each country.
Fixed Income
Global Aggregate – Represented by the Bloomberg Global Aggregate Index which measures the performance of global investment grade debt from twenty-eight local currency markets. This multi-currency benchmark includes treasury, government-related, corporate and securitized fixed-rate bonds from both developed and emerging markets issuers. Global Treasury – Represented by the Bloomberg Global Aggregate Index which measures fixed-rate, local currency government debt of investment grade countries, including both developed and emerging markets. The index represents the treasury sector of the Global Aggregate Index. Global High Yield – Represented by the Bloomberg Global High Yield Index measures the performance of the global high yield debt market.
Real Estate
Local – Represented by the JSE All Property Index which measures the performance of the South African listed property sector. Global – represented by the FTSE EPRA/NAREIT Developed Index which measures the performance of eligible real estate equities worldwide.
All returns are cumulative and measured in United State Dollars. Information in this document regarding market or economic trends, or the factors influencing historical or future performance, reflects the opinions of management as of the date of this document. These statements should not be relied upon for any other purpose. Past performance is no guarantee of future results, and there is no guarantee that the market forecasts discussed will be realised.
