



The first quarter of 2026 was a reminder of how quickly market conditions can shift. After a strong start to
the year, supported by improving sentiment, a softer US Dollar, and broader participation across regions and sectors, markets entered March with a more constructive backdrop than we had seen for some time.
That changed quickly. An escalation in geopolitical conflict and a sharp rise in oil prices brought inflation and
interest rate concerns back into focus, prompting a broad repricing of risk across asset classes. What began as a quarter characterised by improving momentum and diversification ended with a more cautious tone, as markets adjusted to a less certain outlook.
It’s a useful reminder that while the underlying drivers of long-term returns remain consistent, the path to
achieving them is often uneven.
Volatility & Market Structure
A defining feature of recent market behaviour has been the increasing frequency and magnitude of short-term volatility even among the largest and most widely followed companies in global equity markets.
Over the past two decades, the structure of equity markets has evolved meaningfully. One of the most significant shifts has been the rapid rise of passive investing. Index funds and exchange-traded funds now account for a substantial share of global equity ownership. In the United States, passive vehicles represent more than half of total equity fund assets, compared to less than 20% at the start of the century (see graph below).
Passive Investing vs Active Management
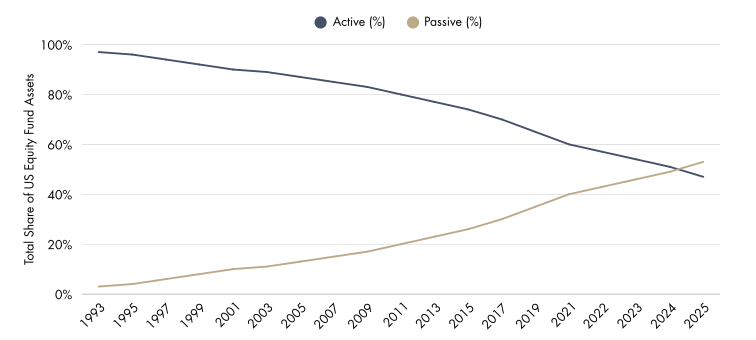
Source: Morningstar Passive Aggressive: The Risks of Passive Investing Dominance.
While this evolution has delivered clear benefits most notably lower costs and broad market access it has also altered how markets behave at the margin.
As a growing proportion of shares are held by effectively permanent owners, such as index funds and long-term institutions, price-setting is increasingly driven by shorter-term, more tactical participants. These include hedge funds, quantitative strategies, market-neutral funds, high-frequency traders, and derivatives-driven investors.
Many of these participants operate with varying degrees of leverage through instruments such as margin financing, options, futures, and swaps. As a result, their tolerance for short-term losses is often limited, leading to rapid repositioning when markets move unexpectedly or when outcomes deviate even modestly from expectations.
This shift has contributed to more pronounced and frequent short-term price movements. Markets are increasingly characterised by sharp reactions, where prices can move significantly over short periods despite relatively small changes in underlying fundamentals.
Recent data highlights this change in behaviour:
- The number of daily moves greater than ±2% in the S&P 500 has increased materially since 2020.
- Large-cap companies now regularly experience single-day moves of 10–20% following earnings announcements.
- Realised volatility has remained elevated, with periods where it has exceeded 20–25%—levels typically associated with times of stress.
- In recent years, the VIX has averaged closer to 20 (see chart below), above its long-term average of around 16–17, suggesting that markets have experienced more frequent and elevated bouts of volatility than in the past (The VIX, often referred to as the market’s “fear gauge”, measures the expected level of volatility in the S&P 500 over the next 30 days based on options pricing. Higher readings typically indicate increased uncertainty and market stress, while lower levels reflect more stable conditions).
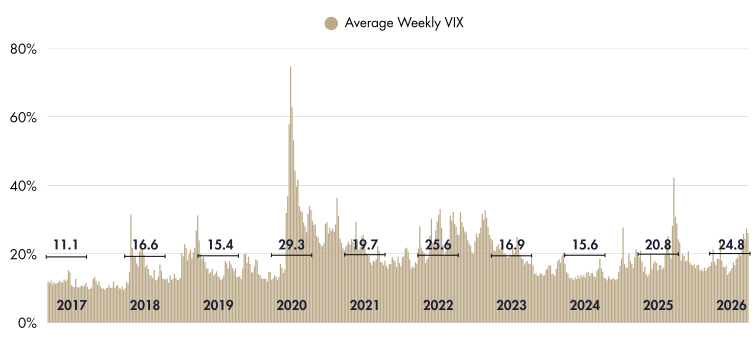
Source: FRED. Data from 1 January 2017 to 31 March 2026. Weekly Average VIX.
At the same time, derivatives trading volumes have grown significantly, in some instances exceeding underlying equity volumes. This has further amplified short-term price movements and contributed to an environment where price discovery can, at times, appear disconnected from long-term value.
In periods such as the current one where geopolitical developments evolve rapidly and sentiment can shift within minutes these dynamics become even more pronounced. Markets respond quickly, often overshooting in both directions.
For investors, this presents a paradox.
On the one hand, the experience of investing has become more challenging. Increased volatility can test conviction, particularly when price movements appear inconsistent with underlying business performance.
On the other hand, this very volatility can create opportunity.
When shorter-term participants are forced to react whether due to leverage, risk constraints, or positioning prices can temporarily diverge from intrinsic value. High quality businesses may be sold not because their long-term prospects have deteriorated, but because of short-term pressures elsewhere in the system.
For investors with patient capital and a disciplined, long-term approach, these periods can offer attractive entry points.
As highlighted in recent investor communications, markets can at times feel “broken” in the short term. However, over longer horizons, business fundamentals continue to assert themselves. Companies compound value over years, not days.
Maintaining perspective is therefore critical.
While market structure has evolved and with it, the path of returns has become more volatile the underlying drivers of long-term wealth creation remain unchanged. Periods of heightened volatility are not new; what has changed is their frequency and intensity.
For committed long-term investors, the challenge is not avoiding volatility, but navigating it with discipline.
And, importantly, recognising that within this volatility lies opportunity.
Equity Commentary
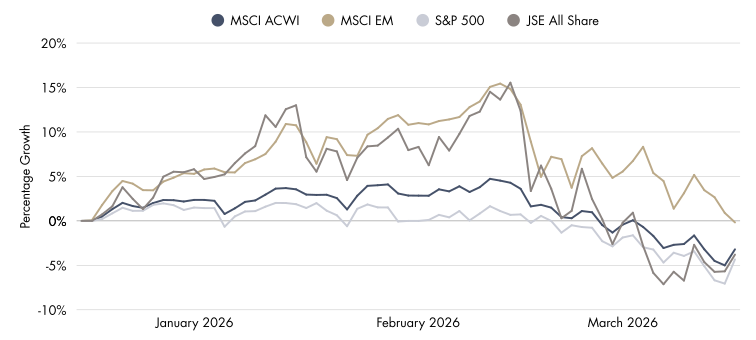
Global equity markets experienced a volatile first quarter, shaped by a clear shift in leadership followed by a sharp reversal in March. Early in the year, markets benefited from broadening participation, with returns increasingly driven by regions and sectors outside the United States. A softer US Dollar, improving capital flows, and strong performance in commodity linked and cyclical sectors supported global equities through January and February.
This constructive backdrop changed abruptly in March. An escalation in conflict in the Middle East drove a sharp spike in oil prices one of the largest monthly increases in decades which in turn reignited concerns around inflation and the trajectory of interest rates. Markets quickly repriced to reflect the risk of tighter financial conditions and slower global growth, leading to a broad based sell off across equity markets.
Source: Lipper. Data as 31 March 2026.
Over the quarter, the S&P 500 declined 4.33% in USD, reflecting both elevated starting valuations and sensitivity to the shift in inflation and rate expectations. In contrast, earlier strength outside the US helped cushion global markets, with the MSCI ACWI falling 3.20%. Emerging markets were a relative bright spot, with the MSCI Emerging Markets Index declining just 0.2%, supported by strong performance in the first two months of the year, more attractive valuations, and exposure to global trade and commodity dynamics.
In South Africa, the FTSE/JSE All Share Index declined 3.8% in USD, with a solid start to the quarter offset by the March sell off. The local market was impacted by both the broader emerging market risk off move and the negative implications of higher oil prices for the domestic economy, despite underlying support from resource linked sectors earlier in the period.
Looking ahead, much will depend on the path of energy prices and whether recent inflation pressures prove temporary or more persistent. While geopolitical developments remain difficult to predict, valuations outside the US have become increasingly compelling, and the broadening of market leadership observed earlier in the quarter remains an important underlying trend. For long-term investors, periods of heightened volatility often present opportunities to add exposure to high quality businesses at more attractive entry points, reinforcing the importance of maintaining a disciplined and globally diversified approach.
Fixed Income Commentary
Global fixed income markets delivered modestly negative returns over the first quarter, with a relatively stable start to the year giving way to a more challenging March. The Bloomberg Global Aggregate Index declined 1.07%, while the Bloomberg Global Treasury Index fell 1.43%, reflecting weaker performance from government bonds. The Bloomberg Global High Yield Index declined 1.31%, as credit markets also came under pressure later in the quarter.

Source: Lipper. Data as at 31 March 2026.
The key driver of the move was a shift in expectations around inflation and interest rates. Earlier in the year, markets had become more comfortable that interest rates had peaked. However, rising energy prices in March reintroduced uncertainty around the inflation outlook, leading to higher bond yields and weaker bond prices.
Government bonds were most affected, while credit markets proved relatively more resilient for much of the quarter, supported by steady corporate fundamentals and the income they provide. However, as market sentiment weakened toward the end of March, credit spreads widened slightly, contributing to negative returns.
Overall, the quarter highlighted that while bonds now offer more attractive income than in recent years, they remain sensitive to changes in inflation expectations. At the same time, this higher level of income continues to provide an important cushion for investors over the long term.
Real Estate Commentary
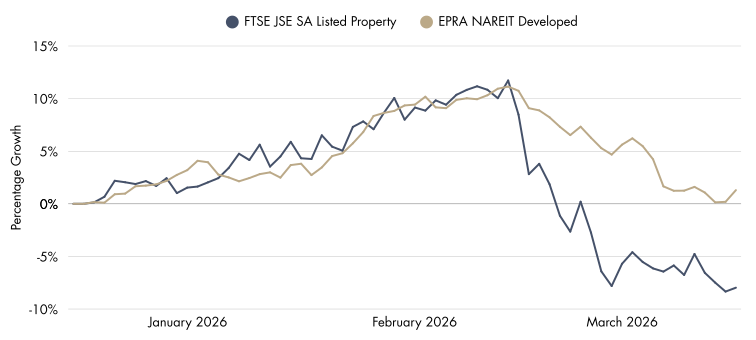
Global listed real estate delivered modestly positive returns over the first quarter, with the FTSE EPRA Nareit Developed Index rising approximately 1.30% in US Dollar terms. Performance was supported by a stable start to the year, where improving sentiment and relatively steady bond yields helped underpin the sector. However, much of these gains were tempered in March as rising energy prices and renewed inflation concerns led to higher bond yields, which weighed on property valuations.
In contrast, South African listed property experienced a more challenging quarter, with the FTSE/JSE SA Listed Property Index declining approximately 7.97% in US Dollar terms. The local sector was impacted by a combination of global risk aversion and sensitivity to rising interest rate expectations, with higher funding cost concerns and weaker investor sentiment weighing on performance.
Source: Lipper. Data as 31 March 2026.
Overall, the quarter highlighted the importance of the interest rate environment for real estate. While the sector continues to offer attractive income characteristics, it remains sensitive to shifts in bond yields and broader market conditions, particularly during periods of heightened uncertainty.
Conclusion
Ultimately, the quarter reinforces something we know well: markets don’t move in a straight line.
Short-term volatility whether driven by policy, positioning, or external shocks is part of the process. What matters is how investors respond to it. Periods like this can feel uncomfortable, but they often create opportunities as prices move ahead of fundamentals.
Staying disciplined, maintaining diversification, and keeping a long-term perspective remain the most effective way to navigate these environments and continue compounding capital over time.
Glossary & Disclosures
Equity
United States – Is represented by the S&P 500 which is an equity market index that measures the share price performance of the 500 largest companies in the United States. South Africa – Is represented by the JSE All Share – The All Share Index represents 99% of the value of all eligible securities listed on the Main Board of the Johannesburg Stock Exchange. Aims to represent the performance of the South African equity market. All Countries – Is represented by the MSCI All Country World Index – Captures large and mid cap representation across 23 Developed Markets and 24 Emerging Markets countries. With 2,920 constituents, the index covers approximately 85% of the global investable equity opportunity set. Emerging Markets – Is represented by the MSCI Emerging Markets Index – Captures large and mid cap representation across 24 Emerging Markets countries. With 1,440 constituents, the index covers approximately 85% of the free float-adjusted market capitalization in each country. Developed Markets – Is represented by the MSCI World Index – The MSCI World Index captures large and mid-cap representation across 23 Developed Markets (DM) countries. With 1,395 constituents, the index covers approximately 85% of the free float-adjusted market capitalization in each country.
Fixed Income
Global Aggregate – Represented by the Bloomberg Global Aggregate Index which measures the performance of global investment grade debt from twenty-eight local currency markets. This multi-currency benchmark includes treasury, government-related, corporate and securitized fixed-rate bonds from both developed and emerging markets issuers. Global Treasury – Represented by the Bloomberg Global Aggregate Index which measures fixed-rate, local currency government debt of investment grade countries, including both developed and emerging markets. The index represents the treasury sector of the Global Aggregate Index. Global High Yield – Represented by the Bloomberg Global High Yield Index measures the performance of the global high yield debt market.
Real Estate
Local – Represented by the JSE All Property Index which measures the performance of the South African listed property sector. Global – represented by the FTSE EPRA/NAREIT Developed Index which measures the performance of eligible real estate equities worldwide.
All returns are cumulative and measured in United State Dollars. Information in this document regarding market or economic trends, or the factors influencing historical or future performance, reflects the opinions of management as of the date of this document. These statements should not be relied upon for any other purpose. Past performance is no guarantee of future results, and there is no guarantee that the market forecasts discussed will be realised.
