



We’re excited to share Bellamont’s Quarterly Market Feedback—a comprehensive look at the trends that shaped the fourth quarter and what they might mean for the path ahead.
As always, your goals remain at the centre of everything we do. We take pride in offering clarity and perspective, ensuring you’re equipped to navigate the ever-changing financial landscape with confidence.
Thank you for entrusting Bellamont with your wealth management journey. Should you have any questions or require further insights, we’re just a call or message away.
“Excellence is the gradual result of always striving to do better.” – Pat Riley
EQUITY REVIEW – A Quarter Dominated by US Politics and Policy Expectations
The final quarter of 2024 was relatively subdued for global equities, with much of the focus centred on US politics. The United States stood out as the sole outperformer, delivering a positive return, while global and developed markets remained largely flat. Emerging markets and currencies, particularly the Rand, faced headwinds due to Dollar strength, resulting in weaker performance when measured in US Dollars.
A significant driver of market movements was the so-called “Trump trade,” as investors reacted to the inflationary policies promoted during Donald Trump’s presidential campaign. These policies fuelled expectations of higher interest rates for an extended period, which led to a spike in bond yields and a strengthening US Dollar. The rally in the Dollar, coupled with a surge in US-based companies, further reinforced the dominance of American markets.
Emerging markets and South Africa bore the brunt of this US-centric narrative, stepping back amidst the rising anticipation of a more inward-focused American economic agenda. While the quarter highlighted the resilience of US markets, it also underscored the vulnerability of other regions to shifts in US policy and Dollar strength.
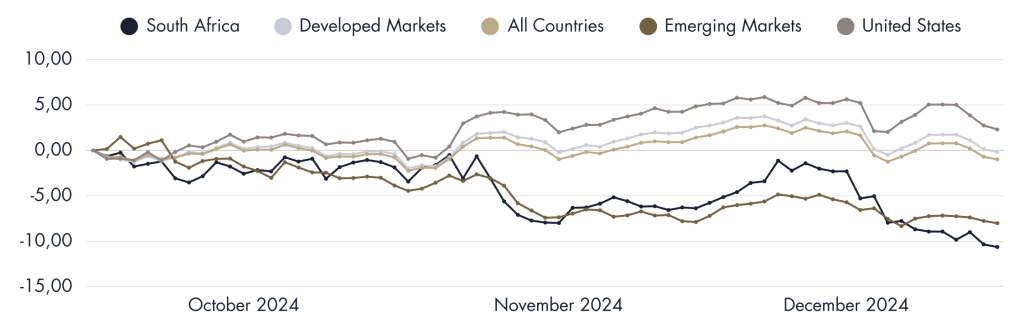
Source: Lipper. Data as at 31 December 2024.
AMERICAN EXCEPTIONALISM
Over the past decade, the performance of the US stock market has been truly remarkable and is worth acknowledging. Much like the saying, a rising tide lifts all boats, US companies have been the driving force behind global equity performance during this period. The graph below illustrates this point by comparing the relative performance of US companies with global equities excluding the US.
The contrast is striking, with a cumulative performance gap of 164.4%. This significant disparity underscores the pivotal role that US companies have played in shaping global equity returns over the last ten years. To put this into perspective, an investment of $10,000 in global equities excluding US companies in 2014 would have grown to $15,990 today. In contrast, the same $10,000 invested solely in American equities would now be worth an astonishing $32,430. This not only highlights the profound impact of being selective in geographical equity exposure but also demonstrates just how extraordinary the performance of the US has been, cementing its position as the dominant engine of global equity growth over the past decade.
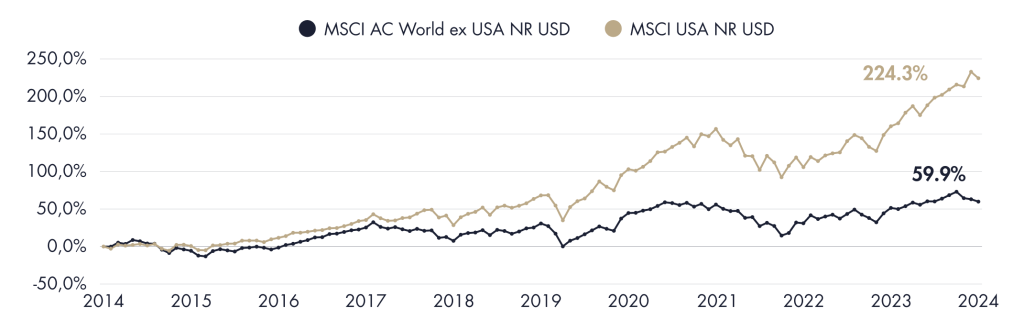
Source: Lipper. Data as at 31 December 2024.
BUFFET INDICATOR
The trend highlighted here is not only fascinating but also historically significant, as it marks the first time the US stock market capitalisation-to-GDP ratio—often referred to as the Buffett Indicator—has surpassed the 200% threshold. This ratio, popularised by Warren Buffett, serves as a broad measure of market valuation. When the stock market’s value far exceeds GDP, it often signals that equity prices may be running ahead of the real economy, reflecting heightened optimism or speculative fervour.
This milestone is a testament to the extraordinary performance of American companies, which, as previously noted, have driven global equity returns over the past decade. The unprecedented rise in the Buffett Indicator underscores the United States’ leadership in global markets and highlights the remarkable growth achieved by its corporations. However, it also offers a reminder of the current stage in the market cycle—one characterised by elevated valuations and potential exuberance. While this record-breaking ratio reflects the strength and innovation of US companies, it also invites questions about sustainability and the balance between market optimism and economic reality.
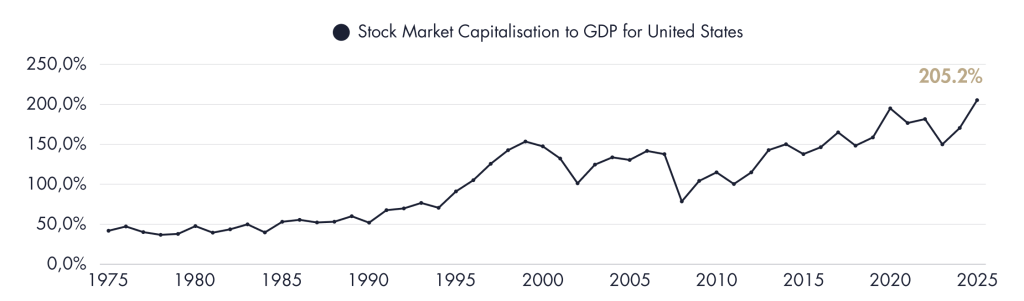
Source: FRED. Data as 31 December 2024.
BEHIND THE CURTAIN OF US MARKET PERFORMANCE
The remarkable performance of the US stock market over the past decade has been driven largely by a select group of companies, which raises important questions about the nature of diversification and the risks inherent in index investing. As highlighted earlier, the US has been the primary engine of global equity returns, with market-leading companies driving exceptional growth. However, a closer look reveals some eye-opening dynamics within the S&P 500 index itself.
The graph to the right underscores the striking disparity between the equal-weighted S&P 500 (where each company carries the same weight) and the traditional market cap-weighted version of the index. At the time of writing, the largest 10 stocks in the cap-weighted index account for a staggering 38% of its total weighting—nearly 20 times their equivalent weighting in the equal-weighted version (just 2%). This concentration raises critical questions: Is index investing truly diversified when so much of the performance is driven by a handful of companies? And what are the hidden risks and potential benefits of such concentration?
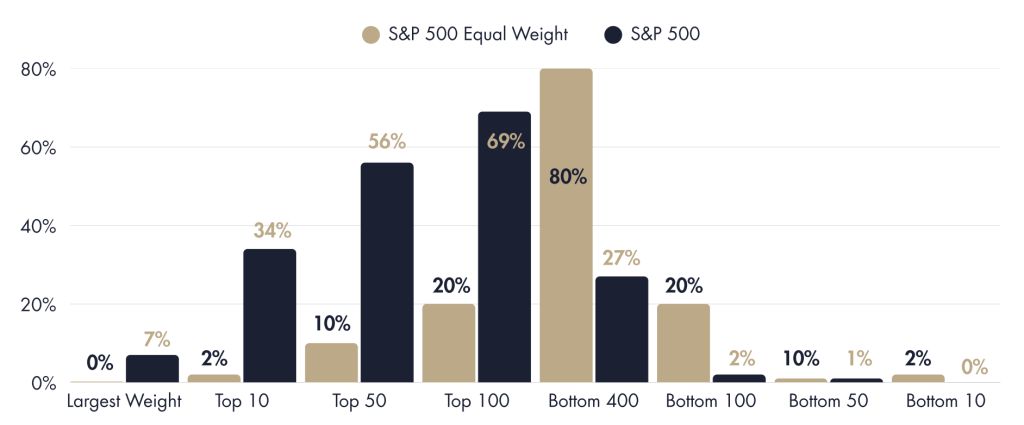
Source: Lipper. Data as at 31 December 2024.
Looking ahead, it remains uncertain whether these dominant companies will continue to lead the charge or whether other, lesser-known firms will step into the spotlight and drive future returns. This poses a complex conundrum for investors. However, one key takeaway is the importance of understanding the underlying structure of the indices you invest in.
At Bellamont, we believe that carefully considered, concentrated investments in high-quality companies with the ability to compound over time will serve investors well, regardless of the prevailing market dynamics or economic conditions. While the broader market trends are fascinating to analyse, it is critical to look beyond the headlines and ensure that your portfolio reflects a clear, thoughtful, and quality-driven approach to long-term wealth creation.
FIXED INCOME REVIEW
The final months of 2024 proved difficult for global treasuries, which declined nearly 6% as inflation ticked higher globally. This modest rise in inflation prompted investors to reassess their expectations for the pace of interest rate cuts, with some central banks striking a more hawkish tone. The re-election of Donald Trump also added to the uncertainty, with his proposed economic policies viewed as inflationary, further lifting rate expectations.
In contrast, corporate bonds continued their strong performance throughout the year, closing the fourth quarter slightly down and significantly outperforming treasuries. Their resilience was driven by their lower sensitivity to interest rate fluctuations and the continued robust performance of underlying companies. Credit spreads continued to narrow over the fourth quarter, defying the broader inflationary and interest rate concerns that weighed on other fixed-income instruments.

Source: Lipper. Data as at 31 December 2024.
INFLATION EASES, BUT PROGRESS FACES NEW CHALLENGES
Over the past few years, global inflation has cooled significantly, with year-on-year headline inflation in most regions now below 3% (refer to the table below). This decline has paved the way for a downward shift in interest rates, as central banks in many regions have responded by easing monetary policy. However, recent months have seen a slight uptick in inflation, raising questions about the pace and sustainability of rate cuts.
It’s essential to acknowledge the progress made in taming inflation. While the recent rise may have tempered expectations for the speed of further rate reductions, inflation levels remain relatively subdued by historical standards. This provides central banks with room to manoeuvre, even if the trajectory of interest rate cuts has become more measured.
Understanding the current stage of the interest rate cycle is critical for investors navigating this landscape. Despite the recalibration of expectations, the broader context of declining inflation and easing monetary policy signals continued opportunities for growth and stability in the global economy.

Source: Macrobond. Data as at 31 December 2024.
NAVIGATING LOCAL INFLATION: A BALANCING ACT IN A GLOBAL CONTEXT
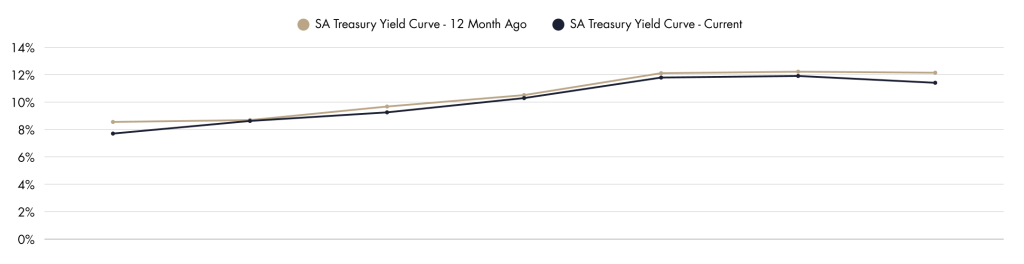
Inflation in South Africa has fallen significantly, with the most recent year-on-year increase in headline inflation dropping below 3%. This places it well below the South African Reserve Bank’s target range of 3% to 6%. Despite this progress, the Reserve Bank remains cautious about lowering interest rates. Economic growth remains stagnant, and the South African government bond yield curve has shown little change over the past 12 months, as depicted below.
The Reserve Bank’s hawkish stance is likely influenced by external factors, particularly the recent rise in US bond yields, which has forced global investors to revise their interest rate expectations upward. The interconnectedness of South Africa’s economy with global markets means that significant rate cuts locally remain contingent on developments in the US. A growing disparity between US and South African interest rates could weaken the rand, triggering higher inflation and eroding the progress achieved so far.
In essence, South Africa’s monetary policy is heavily influenced by external forces, with US economic dynamics effectively “wagging the dog.” The challenge lies in balancing domestic objectives with the realities of a globally integrated economy, ensuring stability without undermining local economic recovery.
Source: World Government Bonds. Data as at 31 December 2024
REAL ESTATE REVIEW – A Volatile Landscape: Real Estate Faces Mixed Fortunes
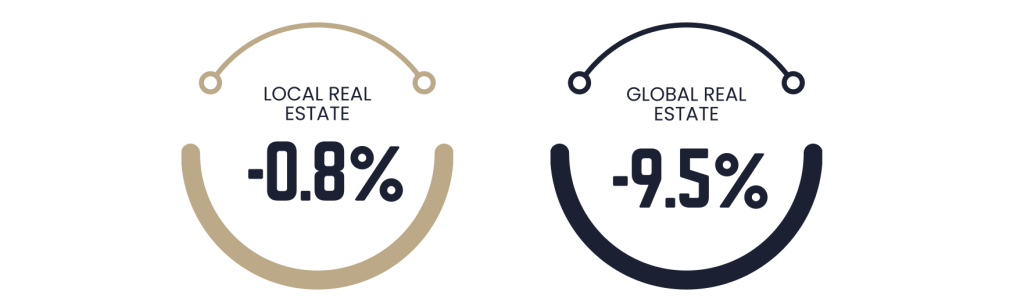
Global real estate markets faced a challenging end to the year as an uptick in global inflation, coupled with potential inflationary policies signalled by President Trump, prompted investors to reassess the pace and scale of future interest rate cuts. Gains from the third quarter were erased as this shift in sentiment created a difficult macroeconomic environment. The outlook for global real estate remains uncertain, with volatility likely to persist as investors respond to evolving economic data and policy developments. Until clarity emerges, returns in this asset class will largely be dictated by macroeconomic trends. However, patient investors may find attractive opportunities in this suppressed market over the longer term.
In contrast, South African real estate has outperformed its global peers, delivering strong relative performance throughout the fourth quarter of 2024. An improving local macroeconomic backdrop, stronger fundamentals, and renewed investor confidence have driven this outperformance. While challenges remain, the South African real estate market is benefiting from a more optimistic narrative.
Source: Lipper. Data as at 31 December 2024.
CURRENCY REVIEW – Rand Under Pressure: A Tale of Dollar Dominance
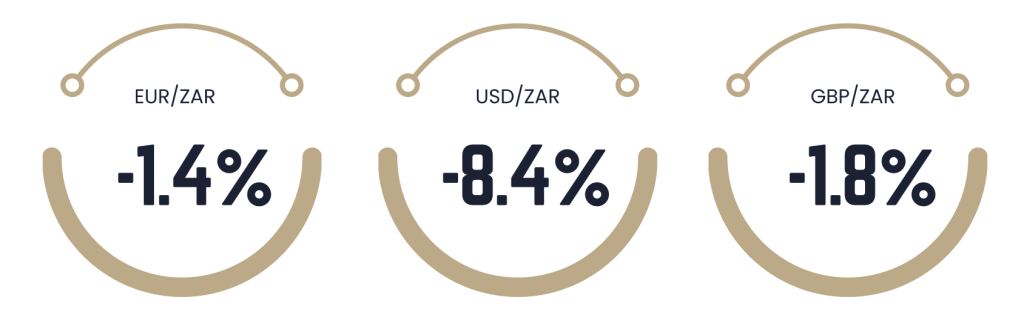
The Rand faced headwinds over the past month, experiencing slight depreciation against the Pound and Euro, and a more pronounced decline against the surging US Dollar. Importantly, this trend was less about inherent weakness in the Rand and more a reflection of the Dollar’s continued strength on the global stage.
The Dollar’s ascent was driven by a combination of factors, including a modest rise in global inflation, heightened policy uncertainty, and a shift in US interest rate expectations. Markets have increasingly embraced a “higher for longer” narrative regarding US rates, providing the Dollar with significant momentum against major currencies.
Source: Lipper. Data as at 31 December 2024.
GLOSSARY & DISCLOSURES
Equity
United States – Is represented by the S&P 500 which is an equity market index that measures the share price performance of the 500 largest companies in the United States. South Africa – Is represented by the JSE All Share – The All Share Index represents 99% of the value of all eligible securities listed on the Main Board of the Johannesburg Stock Exchange. Aims to represent the performance of the South African equity market. All Countries – Is represented by the MSCI All Country World Index – Captures large and mid cap representation across 23 Developed Markets and 24 Emerging Markets countries. With 2,920 constituents, the index covers approximately 85% of the global investable equity opportunity set. Emerging Markets – Is represented by the MSCI Emerging Markets Index – Captures large and mid cap representation across 24 Emerging Markets countries. With 1,440 constituents, the index covers approximately 85% of the free float-adjusted market capitalization in each country. Developed Markets – Is represented by the MSCI World Index – The MSCI World Index captures large and mid-cap representation across 23 Developed Markets (DM) countries. With 1,395 constituents, the index covers approximately 85% of the free float-adjusted market capitalization in each country.
Fixed Income
Global Aggregate – Represented by the Bloomberg Global Aggregate Index which measures the performance of global investment grade debt from twenty-eight local currency markets. This multi-currency benchmark includes treasury, government-related, corporate and securitized fixed-rate bonds from both developed and emerging markets issuers. Global Treasury – Represented by the Bloomberg Global Aggregate Index which measures fixed-rate, local currency government debt of investment grade countries, including both developed and emerging markets. The index represents the treasury sector of the Global Aggregate Index. Global High Yield – Represented by the Bloomberg Global High Yield Index measures the performance of the global high yield debt market.
Real Estate
Local – Represented by the JSE All Property Index which measures the performance of the South African listed property sector. Global – represented by the FTSE EPRA/NAREIT Developed Index which measures the performance of eligible real estate equities worldwide.
All returns are cumulative and measured in United State Dollars apart from the JSE Local Property which is measured in South African Rand. Information in this document regarding market or economic trends, or the factors influencing historical or future performance, reflects the opinions of management as of the date of this document. These statements should not be relied upon for any other purpose. Past performance is no guarantee of future results, and there is no guarantee that the market forecasts discussed will be realised.
