



We are pleased to present to you our Investment Review for the second quarter of 2024. This review serves as an opportunity for us to provide you with insights into the performance of major asset classes and the broader market landscape.
We look forward to seeing you during the quarter and please feel free to contact us if you have any questions.
Your decision to partner with us is a testament to our shared commitment to financial excellence and personalised service. At Bellamont, we are dedicated to delivering tailored investment management and comprehensive financial planning that aligns with your unique goals and aspirations.
“Perfection is not attainable, but if we chase perfection we can catch excellence.” – Vince Lombardi.
EQUITY REVIEW
Global equities had a modest quarter, characterised by increased volatility driven mainly by policy uncertainty from central banks amid global inflation moderation. Companies have demonstrated resilience in the midst of higher interest rates, consistently surpassing analysts’ quarterly earnings expectations. A handful of technology giants continue to lead index returns, giving many investors the illusion that broad, blind exposure to indices is the optimal strategy to manage equity exposure. The optimism surrounding a national unity government, with the potential to create a more conducive environment for economic growth and potentially addressing South Africa’s current systemic challenges, ignited a significant rally in South African equities and the Rand. The All Share index surged nearly 6% in USD terms in a single day and recorded a gain of nearly 12% for the quarter.
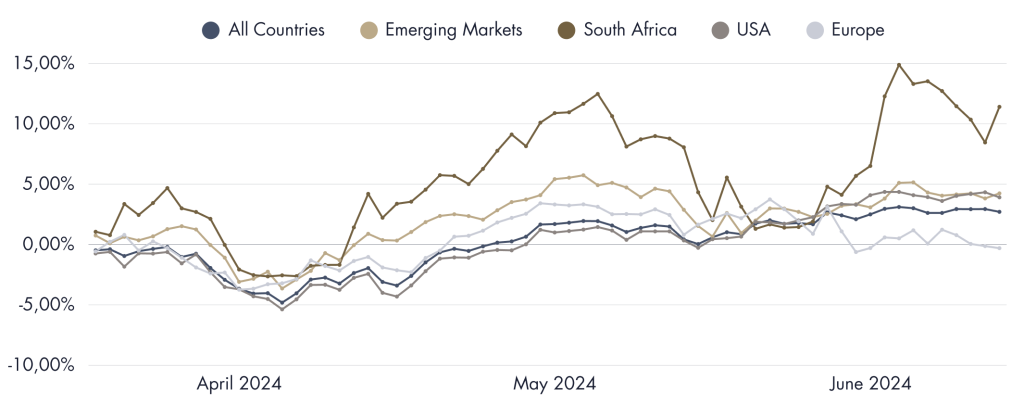
Source: MSCI. Data as at 30 June 2024.
RENEWED OPTIMISM
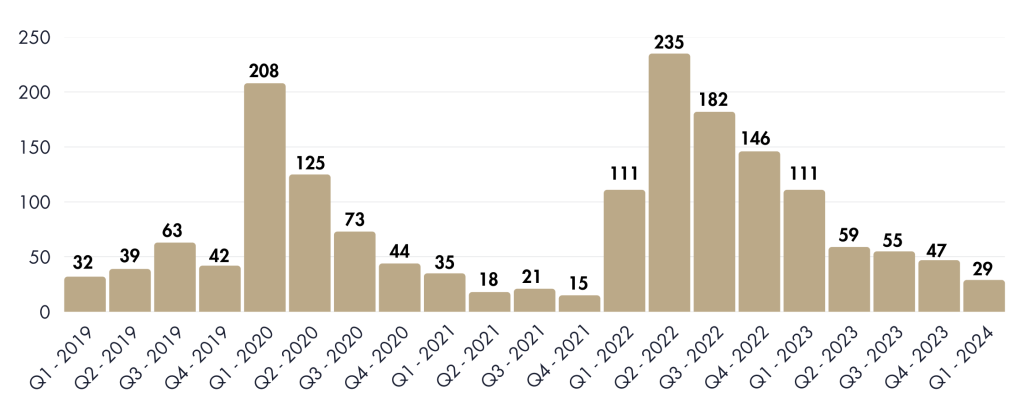
Only 29 of the companies listed in the S&P 500 mentioned the word “recession” during their most recent earnings releases. This marks a stark contrast to the near-majority that expressed recession concerns throughout 2022, highlighting a significant reduction in sentiment regarding recession risk. This trend should instill renewed optimism among investors, given that nearly 80% of companies have exceeded earnings expectations—a substantial increase from the historical average of 66%. Moreover, with the continued deceleration of inflation, the current high interest rate environment could prove to be transitory and the eventual lowering of interest rates would provide a tailwind for American equities.
QUALITY INVESTING – CONSIDERABLE ALPHA
Source: FactSet. Data as at 8 June 2024.
RENEWED OPTIMISM – CAUTION NEEDED
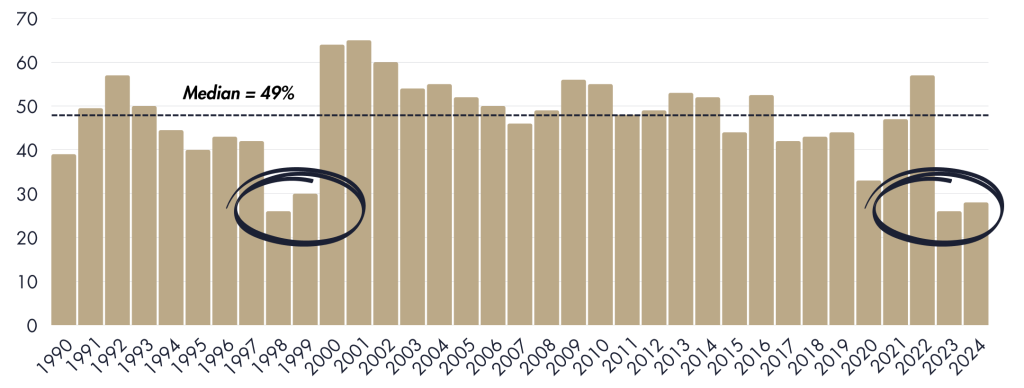
However, despite the increasingly favourable macroeconomic conditions for equities, investors must continue to exercise caution and selectivity in their investment choices. As shown in the graph below, the concentration in the S&P 500’s performance has been significant, reminiscent of the levels seen during the dot-com bubble of the late 1990s and early 2000s. While investors have been rewarded over the past couple of years for allocating blindly to a technology-heavy index, it is crucial to consider whether these few companies, currently priced to perfection, will continue to outperform, or if there will be a resurgence from companies outside the top 10 of the S&P 500. The following page sheds light on this question.
% OF COMPANIES THAT OUTPERFORMED THE S&P 500 INDEX
Source: Richard Bernstein Advisors LLC, BofAML US Strategy. Data as at 4 June 2024.
IS SIZE THE ENEMY OF OUTPERFORMANCE?
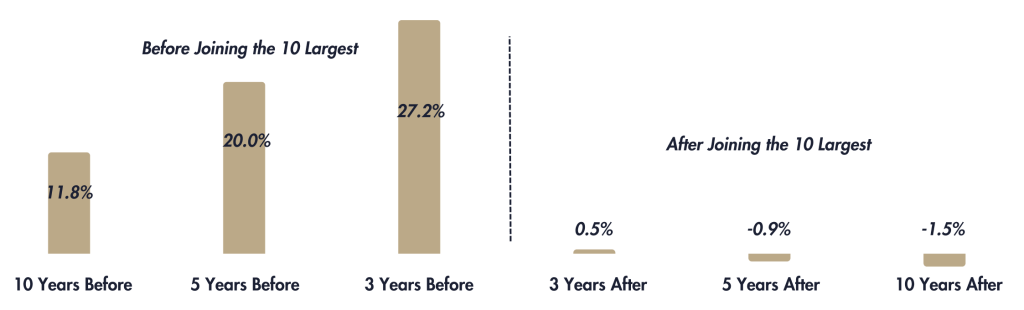
Warren Buffet once noted that, “Size is the enemy of outperformance.” As indicated in the graph below, this has been the case for the majority of American companies, which have delivered considerable outperformance prior to reaching the top 10 in terms of market capitalisation. However, this outperformance tends to fade quickly, with most companies failing to deliver any further outperformance after reaching the top 10. It is currently unclear whether Apple, Microsoft, Nvidia, Google, Amazon, or Facebook will outperform or underperform from their current levels, suggesting we could be entering a new paradigm of market behaviour. However, it is evident that the larger a company becomes, the more challenging it is to sustain the same levels of high growth.
AVERAGE ANNUALISED OUTPERFORMANCE OF COMPANIES BEFORE & AFTER THE FIRST YEAR THEY BECAME ONE OF THE TEN LARGEST IN THE U.S.
Source: Dimensional Fund Advisors. Data from 1927 to 2023.
EXPECTATIONS
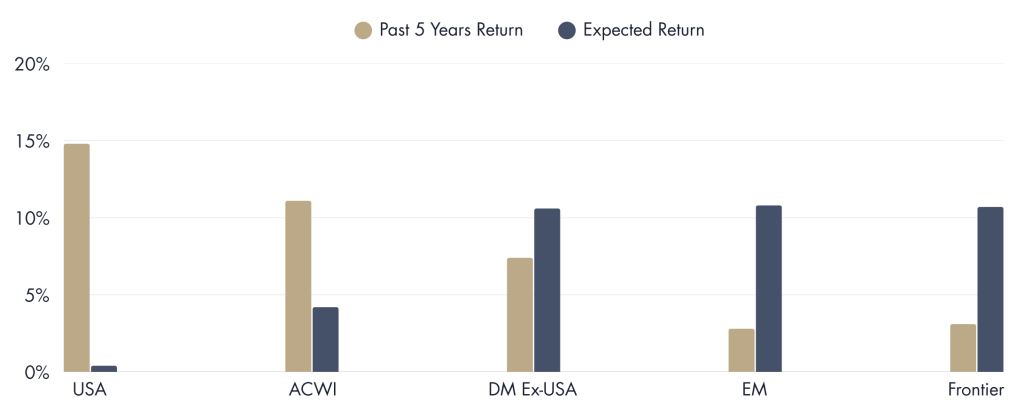
Analysing the total returns over the past five years and comparing them to the expected returns over the next five years (based on dividend yield, expected growth, and expected valuation change) reveals an interesting outlook. These figures suggest that the US may face a challenging few years ahead, while emerging and frontier markets offer compelling returns. However, these are only expectations, and the only certainty is that the US has shown considerable outperformance, whereas emerging, frontier, and developed markets excluding the US remain relatively inexpensive. Only time will tell who the eventual winners will be in the next cycle, but as always, there are opportunities for savvy investors.
GLOBAL EQUITIES – CAPITAL MARKET ASSUMPTIONS
Source: London Stock Exchange Group. Data as at 31 May 2024.
FIXED INCOME REVIEW
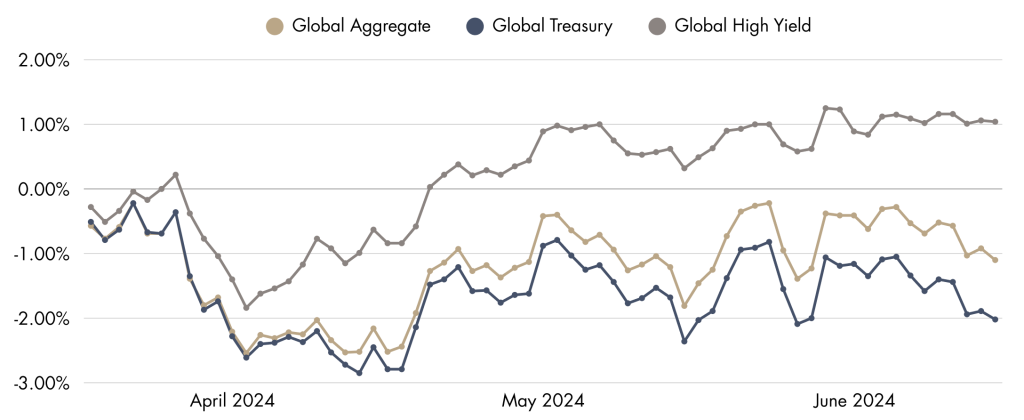
Global fixed income markets experienced a modest quarter, with inflation and policy shifts continuing to dominate headlines. Investors have been continuously updating forecasts based on monthly data, resulting in heightened sensitivity to economic indicators and making the market particularly reactive to recent data releases. Globally, inflation continues to trend downward, with economies showing signs of strain through generally lower economic growth and higher unemployment figures. However, most central banks remain hawkish, indicating a willingness to maintain restrictive policies for longer, which pushed yields higher over the quarter. Consequently, the Bloomberg Global Treasury Index lost 2% over the past three months. In contrast, companies have largely continued to surpass earnings expectations, leading to further narrowing of credit spreads, and the Bloomberg Global High Yield Index delivered a positive return of 1% over the course of the quarter.
Source: Bloomberg. Data as at 30 June 2024.
WARNING SIGNS?
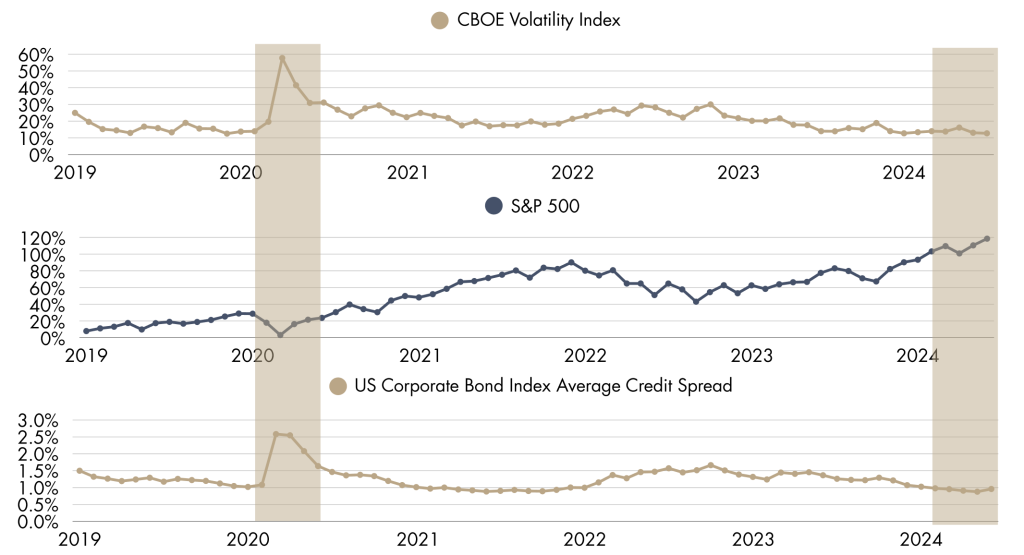
Volatility and credit spreads typically exhibit a negative correlation with equity markets. When equity markets trend upwards (downwards), credit spreads tend to narrow (widen) and volatility tends to fall (rise). This relationship is illustrated by the graphs on the following page, with volatility (measured by the Chicago Board Options Exchange’s Volatility Index, based on S&P 500 index options) and credit spreads (measured by the average credit spread on the US Corporate Bond Index) are currently near historically low levels, while the S&P 500 continues to reach new highs. Given the current macroeconomic backdrop, it is challenging to argue that these levels will remain unchanged in the foreseeable future. A weakening economic environment is likely to reverse the current trend. Therefore, although the S&P 500 has delivered impressive relative returns for investors over the past few years, caution must be applied when allocating to this region, as there are warning signs that the current period of prosperity may be coming to an end. At Bellamont, we advocate for selectivity, as blindly allocating to an index in pursuit of outsized returns from the artificial intelligence boom could be detrimental to a portfolio’s long-term prospects.
Source: FRED. Data as at 30 June 2024.
SOUTH AFRICA – A NEW HOPE
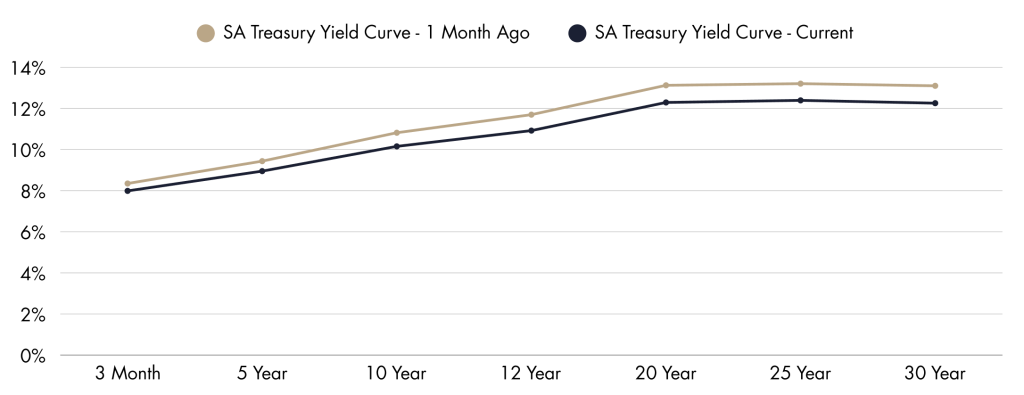
A government of national unity (GNU), no longer dominated by an ANC majority, has sparked hope in South Africa. As illustrated in the graph below, yields on South African Treasuries have fallen over the past month following the release of election results, reflecting investor optimism about the new government. This government has the potential to implement more economically friendly policies and address some of the systemic issues the country currently faces. However, the inner workings of the GNU remain unclear at this stage, and investors should avoid being overly optimistic until more clarity is provided.
Source: World Government Bonds. Data as at 30 June 2024.
REAL ESTATE REVIEW
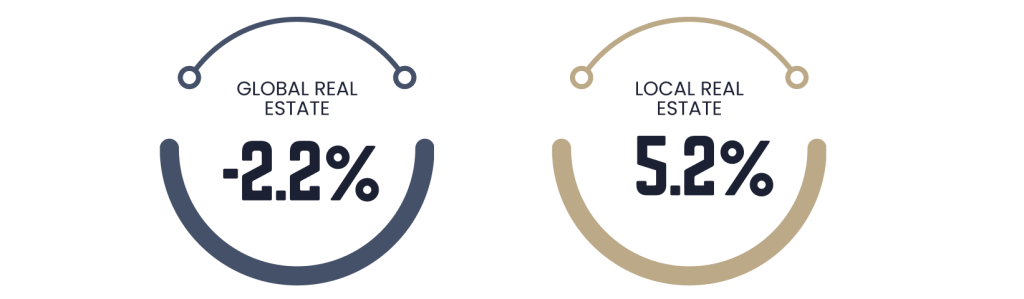
Stable inflation of 5.2% over April and May, which is within the Reserve Bank’s target range of 3% to 6%, has renewed belief in a policy shift, with a growing consensus of two interest rate cuts before the end of 2024. This, coupled with a more positive political outlook, provided the impetus for the South African real estate market to have a positive quarter, gaining over 5% in the past three months. The current macroeconomic environment remains challenging for global real estate, with policy uncertainty and elevated interest rates continuing to pose obstacles. However, we maintain confidence in the fundamentals of our real estate investments to withstand a period of higher interest rates. We anticipate that an inevitable shift in policy will eventually provide the asset class with a much-needed boost. Despite uncertainty about the timing of this shift, we remain committed as long-term investors and look beyond any short-term relative underperformance.
Source: London Stock Exchange Group. Data at at 30 June 2024.
CURRENCY REVIEW
The South African Rand strengthened against major currencies in the last few weeks of June and ended the quarter on a much stronger note. The prospect of economic reform and improved service delivery under the proposed government of national unity revitalised investor confidence, bolstering the Rand with much-needed resilience.

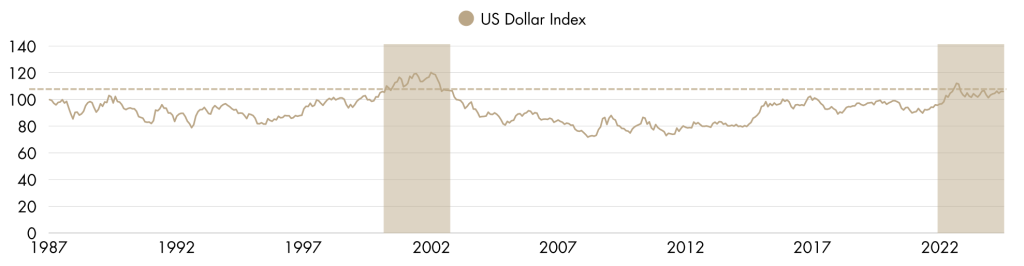
The US Dollar Index measures the value of the US Dollar relative to a basket of foreign currencies, including the Euro, Japanese Yen, Canadian Dollar, British Pound, Swedish Krona, and Swiss Franc. As indicated by the dashed line below, there has been only a few instances in nearly four decades where the US Dollar has shown such strength. This was mentioned in the previous quarterly review and has been included again as the US Dollar continues to strengthen against major currencies. The last time the US Dollar demonstrated such sustained strength was during the dot-com bubble in the early 2000s. This may be coincidental, but it is not the only parallel we are currently observing with the early 2000s.
Source: FRED. Data at at 30 June 2024.
GLOSSARY & DISCLOSURES
Equity
USA – Represented by the the MSCI USA Index which is designed to measure the performance of the large and mid cap segments of the US market, with 610 constituents. South Africa – Represented by the MSCI South Africa Index which is designed to measure the performance of the large and mid cap segments of the South African market, with 32 constituents. All Countries – Represented by the MSCI All Country World Index which captures large and mid cap representation across 23 Developed Markets and 24 Emerging Markets countries, with 2,920 constituents. Emerging Markets – Represented by the MSCI Emerging Markets Index which captures large and mid cap representation across 24 Emerging Markets countries, with 1,440 constituents. Europe – Represented by the MSCI Europe Index captures large and mid cap representation across 15 Developed Markets countries in Europe, with 421 constituents.
Fixed Income
Global Aggregate – Represented by the Bloomberg Global Aggregate Index which measures the performance of global investment grade debt from twenty-eight local currency markets. This multi-currency benchmark includes treasury, government-related, corporate and securitized fixed-rate bonds from both developed and emerging markets issuers. Global Treasury – Represented by the Bloomberg Global Aggregate Index which measures fixed-rate, local currency government debt of investment grade countries, including both developed and emerging markets. The index represents the treasury sector of the Global Aggregate Index. Global High Yield – Represented by the Bloomberg Global High Yield Index measures the performance of the global high yield debt market.
Real Estate
Local – Represented by the JSE All Property Index which measures the performance of the South African listed property sector. Global – represented by the FTSE EPRA/NAREIT Developed Index which measures the performance of eligible real estate equities worldwide.
All returns are cumulative and measured in United State Dollars apart from the JSE Local Property which is measured in South African Rand. Information in this document regarding market or economic trends, or the factors influencing historical or future performance, reflects the opinions of management as of the date of this document. These statements should not be relied upon for any other purpose. Past performance is no guarantee of future results, and there is no guarantee that the market forecasts discussed will be realised.
