



The second quarter of 2026 was one of the most instructive three-month periods in recent memory. It began in fear: markets were still absorbing the escalation of conflict in the Middle East, Brent crude had traded near $120 a barrel, and global equities had just recorded their worst quarter in years. It ended in something close to euphoria, with several major indices at or near record highs, the largest initial public offering in history completed, a new era underway at the US Federal Reserve, and the oil price back at pre-crisis levels following the de-escalation of the conflict and the reopening of the Strait of Hormuz.
An investor who reacted to March’s headlines by moving to the sidelines would have missed one of the strongest quarters for global equities this century. That is not a lesson about optimism, it is a lesson about process. The best and worst periods in markets tend to arrive close together, they arrive without warning, and the cost of being absent for the recovery is usually far greater than the comfort of avoiding the drawdown. Discipline, not instinct, is what carries investors through both.
In this review we look at what drove the recovery, three developments from the quarter that we believe carry lasting lessons for investors, and how the major asset classes performed along the way.
A Perspective From The Quarter
The Largest IPO In History And What It Reveals About Indices
On 12 June, SpaceX listed on the Nasdaq under the ticker SPCX, pricing at $135 per share and raising roughly $75 billion, the largest initial public offering ever completed, comfortably eclipsing the record Saudi Aramco set in 2019. The shares opened above $150 and ended their first day near $161, valuing the company at around $2.1 trillion and placing it immediately among the largest listed companies in the world.
Readers of our recent client notes will know we have been following this event for some time, not primarily as a story about SpaceX itself, but as a live demonstration of how modern index investing actually works. The quarter did not disappoint. To accommodate the listing, Nasdaq and FTSE Russell rewrote their inclusion rules: Nasdaq introduced a ‘fast entry’ path that allows very large companies into the Nasdaq-100 just fifteen trading days after listing, while FTSE Russell allowed entry after five. SpaceX duly joined the Russell indices on 26 June and the Nasdaq-100 on 7 July. The consequence is that funds tracking these benchmarks, more than $1.4 trillion follows the Nasdaq-100 alone were required to buy billions of dollars of SpaceX shares within weeks of its debut, at whatever price prevailed, into a free float of only around 4% of the company. This is the mechanism we have written about before: index inclusion creates concentrated, price insensitive demand, and the smaller the available float, the more forceful its effect on the share price.
One major index provider declined to follow. S&P Dow Jones Indices confirmed that it would retain the S&P 500’s twelve month seasoning period and its requirement for four consecutive quarters of profitability, a test that SpaceX, which reported a net loss of roughly $4.9 billion in 2025, does not yet meet. The world’s most widely tracked index will therefore not hold the world’s largest IPO until the middle of 2027 at the earliest.
We would draw two lessons from the episode. The first is that ‘passive’ investing is not passive in effect. Index inclusion is an active decision, made by committees, and it is capable of directing enormous mechanical flows into a single stock regardless of its price or profitability and, as this quarter demonstrated, the rules themselves can change under commercial pressure. The second is that index choice matters more than many investors appreciate. Two investors who each believe they own ‘the US market’, one through the Nasdaq 100, the other through the S&P 500, now hold meaningfully different exposures to a $2 trillion company. Understanding precisely what you own, and why, has rarely been more valuable.
A Tripling and a Doubling On Single Digit Multiple
In June, South Korea’s Kospi index recorded its best quarterly performance since 1998. The move was led by two companies, SK Hynix and Samsung Electronics, which roughly tripled and doubled in value respectively over the quarter and, in the process, both joined the small club of companies worldwide valued at more than $1 trillion. Despite the scale of the move, both ended the quarter trading at single digit multiples of forward earnings, SK Hynix at roughly seven times, Samsung at roughly six.
A tripling and a Doubling On a Single Digit Multiple
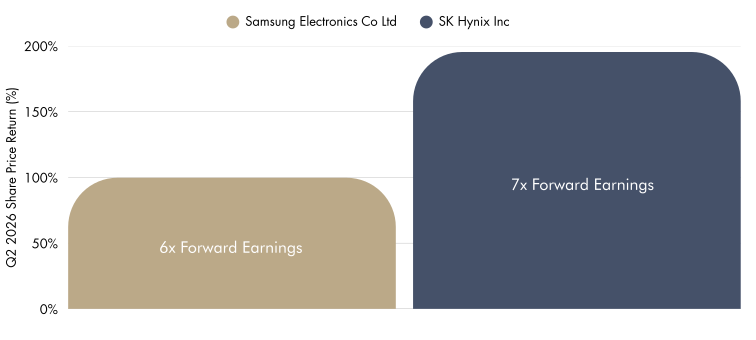 Source: Bloomberg, company reports. Approximate Q2 2026 share price returns and forward earnings multiples.
The instinctive read is that a business tripling in value while its multiple stays in single digits must still be cheap. We would resist that conclusion. A forward P/E is only as trustworthy as the earnings it is measured against, and the earnings memory chip producers are generating right now sit near the top of an unusually favourable cycle, a period of tight supply and AI driven demand that has pushed memory pricing, and margins, well above their historical average. A single digit multiple on cyclically elevated earnings is not the same thing as a single digit multiple on durable, normalised earnings, and treating the two as interchangeable is one of the more reliable ways value conscious investors get caught out.
Memory chips are, in fact, a textbook industry for this trap. Pricing has moved through repeated boom bust cycles over the past two decades, and the mechanism is familiar: elevated margins invite capacity investment from the same handful of large producers and increasingly from new entrants in China which typically arrives eighteen to twenty-four months later, just as demand growth begins to decelerate. DRAM and NAND pricing each fell by more than half in both the 2018-19 and 2022-23 downturns, in both cases following periods that looked, at the time, just as structurally supported as this one. There is a reasonable argument that AI driven demand is more durable than the smartphone and PC cycles behind prior supercycles. But ‘more durable’ is not the same as ‘immune,’ and the scale of capital currently being committed across the industry is precisely the kind of collective response that has ended memory upcycles before.
None of this is an argument against owning AI exposed businesses, and we are not suggesting SK Hynix or Samsung are mispriced only that the multiple alone cannot tell you they are not. The more useful question, and the one we ask of every manager we partner with, is whether today’s earnings represent a company’s normalised earning power or a high water mark that supply, competition, or a cooling in capital spending could erode. A cheap looking number is a question, not an answer.
When The Consensus Trade Unwinds
A year ago, the positioning many investors regarded as simple common sense was to own gold and silver, after one of the strongest multi-year runs for precious metals in decades, a run supported by persistent inflation concern, growing government deficits, and a softer US dollar. Owning them felt less like a bet than a hedge everyone agreed on.
Six months into 2026, that positioning has come apart. Gold suffered its steepest single-month decline since 1975 during the second quarter, and silver fell by more than half from its recent high, among the sharpest reversals either metal has experienced in a generation. By quarter end, gold and bitcoin, both widely held as inflation hedges and momentum trades a year earlier, ranked among 2026’s worst performing major asset classes, while the areas investors had largely given up on, small-cap value, emerging markets, and broadly diversified portfolios were among the best.
We raise this not to claim any ability to have called the top in gold, nor to suggest that whatever is unloved today will mechanically outperform tomorrow that would simply swap one narrative for another. The point is narrower. A trade earns the label ‘safe’ or ‘consensus’ only after the crowd has positioned around it and moved the price to reflect that conviction. By the time an asset feels obviously correct to own, much of the reward for owning it has typically already been collected, and what remains is less a bet on the underlying asset than a bet on the crowd’s continued agreement with itself. It is, in a sense, the same lesson the semiconductor story teaches from the opposite direction: the market price alone, whether it has just tripled or has simply ‘always gone up,’ tells you nothing about what is supporting it. That question has to be asked continually, of everything one owns.
Equity Commentary
Global equity markets staged one of the sharpest recoveries in recent history during the second quarter. As tensions in the Middle East de-escalated and the oil price retreated from its April peak toward pre-crisis levels, risk appetite returned in force. The S&P 500 returned 15.20% in USD, its strongest quarter since the post-pandemic rebound of 2020 while the MSCI ACWI gained 14.93%. Emerging markets led all regions, with the MSCI Emerging Markets Index up 24.05%, its best quarter since 2009, powered by the South Korean and Taiwanese semiconductor complex at the heart of the AI infrastructure build out, where global hyperscalers raised their combined 2026 capital spending guidance to roughly $700 billion.
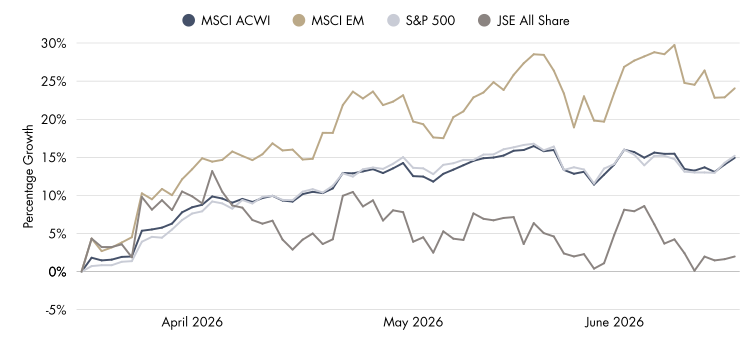
Source: Lipper. Data as 30 June 2026.
Just as encouraging as the headline numbers was the breadth beneath them. After three years in which a small group of mega-cap technology companies accounted for a disproportionate share of returns, leadership widened meaningfully over the quarter. Small and mid-cap companies posted their best first half since the early 1990s, value benchmarks reasserted themselves in June as investors took profits in extended growth positions, and equal-weighted indices pushed to new highs even as the cap-weighted leaders consolidated. Broadening participation of this kind is generally a sign of health in a rally, as it reduces the market’s dependence on a handful of companies continuing to deliver.
At home, the quarter was one of consolidation. The FTSE/JSE All Share Index returned 1.98% in USD, with solid gains through May partially retraced in June as the rand softened against a resurgent dollar and the gold counters tracked the metal’s global pullback. The South African Reserve Bank moved early against imported inflation, raising the repo rate by 25 basis points in May, a proactive step that supports the Bank’s hard won credibility, even if it weighed on sentiment in the near term.
Fixed Income Commentary
The quarter’s fixed income story was one of divergence: credit meaningfully outperformed government bonds, and the gap tells you most of what you need to know about the period. The Bloomberg Global High Yield Index returned 3.50% in USD roughly seven times the 0.51% return of the Bloomberg Global Treasury Index while the broader Bloomberg Global Aggregate Index finished at 0.87%.
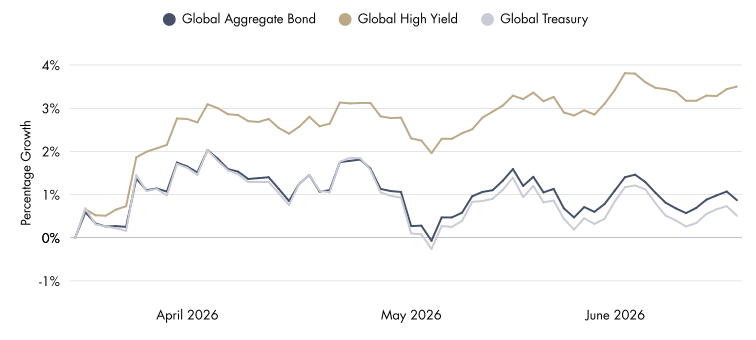
Source: Lipper. Data as at 30 June 2026.
The paths are more revealing than the endpoints. Government bonds actually performed respectably through April and May before giving back their gains in June, as the interest rate outlook shifted under the Federal Reserve’s new chair, Kevin Warsh. At his first policy meeting in mid-June, the committee held rates steady but removed its long standing easing bias from the statement, and markets moved from pricing multiple rate cuts for the remainder of 2026 to pricing a realistic possibility of a further hike, a substantial repricing, with energy driven cost pressures having lifted US core inflation to its highest level since 2023. The US 10-year Treasury yield touched 4.67% in mid-May before settling near 4.47% at quarter end.
Credit, by contrast, climbed steadily throughout the quarter. Spreads tightened across both investment-grade and high-yield markets, supported by robust corporate earnings and healthy fundamentals, and the market comfortably absorbed elevated new issuance from AI related borrowers including a landmark $25 billion debut bond transaction from SpaceX, the largest first-time issue by an investment-grade company on record, completed alongside its IPO. The lesson from the quarter is that fixed income is not a single, homogenous asset class. Government bonds remain acutely sensitive to shifts in the inflation and policy outlook; credit is driven as much by the health of the underlying businesses as by the rate cycle. With starting yields still meaningfully higher than during the zero-rate era, income continues to do the heavy lifting for bond investors providing a genuine cushion even through a quarter in which rate expectations reversed direction entirely.
Real Estate Commentary
Listed real estate had a strong second quarter globally. The FTSE EPRA Nareit Developed Index returned 8.82% in USD, a result achieved despite government bond yields rising over the period, a useful corrective to the conventional wisdom that property is simply a ‘rates trade.’ Earnings growth, balance sheet strength and structural demand in segments such as data centres and residential continued to do the work, and the sector’s ability to advance through a period of yield volatility speaks to the quality of what now sits within it.
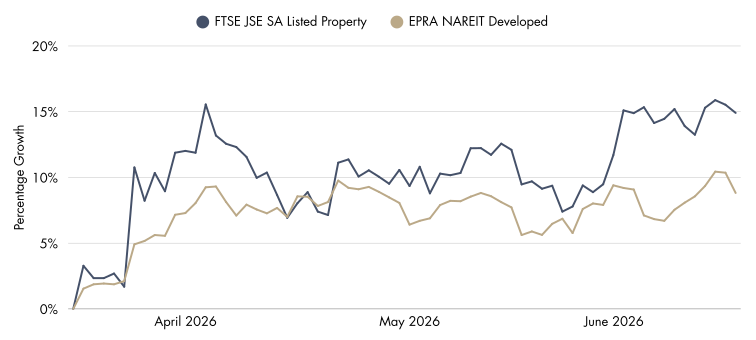
Source: Lipper. Data as 30 June 2026.
South African listed property had a notably strong quarter of its own: the FTSE/JSE All Property Index (ALPI) returned 14.91% in USD, climbing steadily through a domestic rate hike in May.
Conclusion
Ultimately, the quarter reinforces something we know well: markets don’t move in a straight line. Three months that began with war, an oil shock, and one of the sharpest equity sell-offs in years ended with several major indices at record highs, the largest IPO in history completed, and a changing of the guard at the world’s most important central bank. Through all of it, the investors who fared best were not those who predicted the turn, but those whose process never required them to.
The quarter’s three stories, an index system rewriting its own rules to absorb a $2 trillion newcomer, a semiconductor rally that looks cheap only if today’s earnings prove durable, and a consensus trade in precious metals that unwound almost overnight, all point toward the same underlying discipline. Benjamin Graham captured it nearly a century ago:
“In the short run, the market is a voting machine. But in the long run, it is a weighing machine.”
— Benjamin Graham
A great many votes were cast this quarter, by index committees, by momentum buyers, by the crowd rushing back into risk. The weighing comes later, and it is the weighing that determines long-term outcomes. Our job, and that of every manager we partner with, is to keep asking what each asset actually weighs: which earnings are normal, which prices are supported, and which are merely being voted for at the moment.
We are grateful for the continued trust you place in us, and we remain committed to managing your capital with the discipline, patience and care it deserves.
Glossary & Disclosures
Equity
United States – Is represented by the S&P 500 which is an equity market index that measures the share price performance of the 500 largest companies in the United States. South Africa – Is represented by the JSE All Share – The All Share Index represents 99% of the value of all eligible securities listed on the Main Board of the Johannesburg Stock Exchange. Aims to represent the performance of the South African equity market. All Countries – Is represented by the MSCI All Country World Index – Captures large and mid cap representation across 23 Developed Markets and 24 Emerging Markets countries. With 2,920 constituents, the index covers approximately 85% of the global investable equity opportunity set. Emerging Markets – Is represented by the MSCI Emerging Markets Index – Captures large and mid cap representation across 24 Emerging Markets countries. With 1,440 constituents, the index covers approximately 85% of the free float-adjusted market capitalization in each country. Developed Markets – Is represented by the MSCI World Index – The MSCI World Index captures large and mid-cap representation across 23 Developed Markets (DM) countries. With 1,395 constituents, the index covers approximately 85% of the free float-adjusted market capitalization in each country.
Fixed Income
Global Aggregate – Represented by the Bloomberg Global Aggregate Index which measures the performance of global investment grade debt from twenty-eight local currency markets. This multi-currency benchmark includes treasury, government-related, corporate and securitized fixed-rate bonds from both developed and emerging markets issuers. Global Treasury – Represented by the Bloomberg Global Aggregate Index which measures fixed-rate, local currency government debt of investment grade countries, including both developed and emerging markets. The index represents the treasury sector of the Global Aggregate Index. Global High Yield – Represented by the Bloomberg Global High Yield Index measures the performance of the global high yield debt market.
Real Estate
Local – Represented by the JSE All Property Index which measures the performance of the South African listed property sector. Global – represented by the FTSE EPRA/NAREIT Developed Index which measures the performance of eligible real estate equities worldwide.
All returns are cumulative and measured in United State Dollars. Information in this document regarding market or economic trends, or the factors influencing historical or future performance, reflects the opinions of management as of the date of this document. These statements should not be relied upon for any other purpose. Past performance is no guarantee of future results, and there is no guarantee that the market forecasts discussed will be realised.
