



The “Magnificent Seven” companies namely, Alphabet, Amazon, Apple, Meta Platforms, Microsoft, Nvidia and Tesla have piqued everyone’s interest of late, dominating market returns and have reached a combined market capitalisation more than $13 trillion. To put this into perspective, this equates approximately to the Gross Domestic Product (GDP) of Japan, Germany, India and the United Kingdom combined (the third to sixth largest GDPs in the world). The eyewatering average return of 111% achieved over the course of 2023 by these companies contributed to these lofty valuations.
The rise and fall of the go-go funds in the 1960s, the Nifty Fifty in the 1970s and the technology darlings in 1990s have largely shaped our expectations for the Magnificent Seven. However, most recently, the performance of the FANG companies namely, Facebook (now Meta Platforms), Amazon, Netflix and Google (now Alphabet) bucked the trend and have continued to deliver stellar performance year after year.
The below article will compare the Magnificent Seven to their predecessors with the purpose of determining whether this time will be different or will the Magnificent Seven add to the dismal record of glamour stocks. The Magnificent Seven will be analysed according to –
- The extent to which the group dominates the American equity market;
- The companies’ valuations as represented by their Price/Earnings (P/E) ratios; and
- Their perspective business growth.
The first two aspects are readily available and can be easily measured, however, the final consideration is critically important but regrettably difficult to determine.
MARKET IMPACT
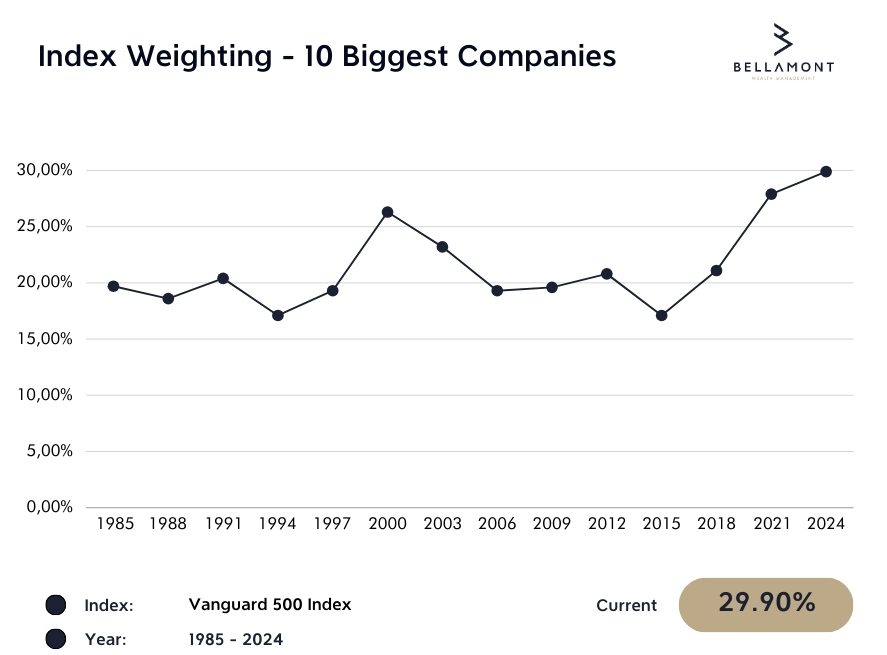
The chart below shows the percentage of Vanguard 500 Index invested in the portfolio’s 10 largest stocks, from 1985 through January 2024.
Source: Lipper. Data as at 31 December 2023.
We have entered uncharted territory! Of that 29.9%, all but 2 percentage points come from the Magnificent Seven, which account for the entire top 10 stake except for a 1.7% position in Berkshire Hathaway and 1.3% in Broadcom.
An ill wind blows. For one, the only other time the index was anywhere near this concentrated, was entering the year 2000, which was the very worst occasion in which to buy it. For another, 2013′s unusually low percentage reminds us that when the FANG stocks first became famous, they had much room ahead of them. In spring 2013, Google, Amazon, and Netflix accounted for only 2.3% of the S&P 500, in aggregate, and Facebook had not even been accepted into the index.
The top 10 indicator has a sample size of two, which is about as far from statistical significance as one can get. Its signal, however, is flashing bright red.
Unfortunately, the Nifty Fifty was excluded as the concentration of the S&P 500 could not be readily calculated during the 1970s.
INVESTMENT VALUATIONS
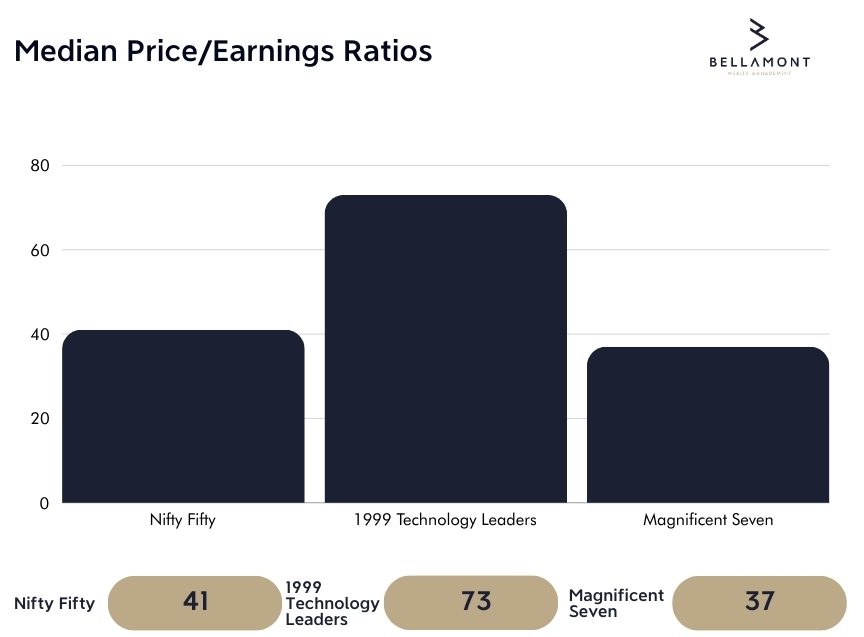
The next graph shows the median P/E ratios for
- The Nifty Fifty at their 1972 highs;
- The seven largest technology stocks in December 1999; and
- The Magnificent Seven today.
(Note: The exhibit omits the ratios for the FANG stocks because in March 2013, only Google boasted significant earnings. The ratios for the other FANG stocks were either non-existent or incomprehensibly high, as those three firms were ploughing all their free cash back into their businesses.)
Source: Lipper. Data as at 31 December 2023.
That’s much more encouraging. By this measure, the Magnificent Seven are slightly cheaper than the Nifty Fifty were before those stocks imploded. While that achievement may seem dubious, given the latter’s rather dire fate, there is a significant difference in circumstances. The Nifty Fifty was a much less exclusive group than the Magnificent Seven. Many of the Nifty Fifty’s members ran ordinary businesses, not dominant ones.
What’s more, the new millennium’s stars were much costlier than today’s aspirants. Among the biggest technology stocks of that era, only the decades-old organisations of Intel and IBM carried P/E ratios that resembled those of the Magnificent Seven.
BUSINESS PROSPECTS
Ultimately, operational results matter most when determining future long-term stock market returns. The Nifty Fifty failed that test because they embodied the overall US economy—the club possessed too many members and included too many industries to be otherwise—and the nation’s economy fared poorly over the next decade. In fact, when adjusted for inflation, earnings for the S&P 500′s companies were lower in 1982 than they were 10 years before.
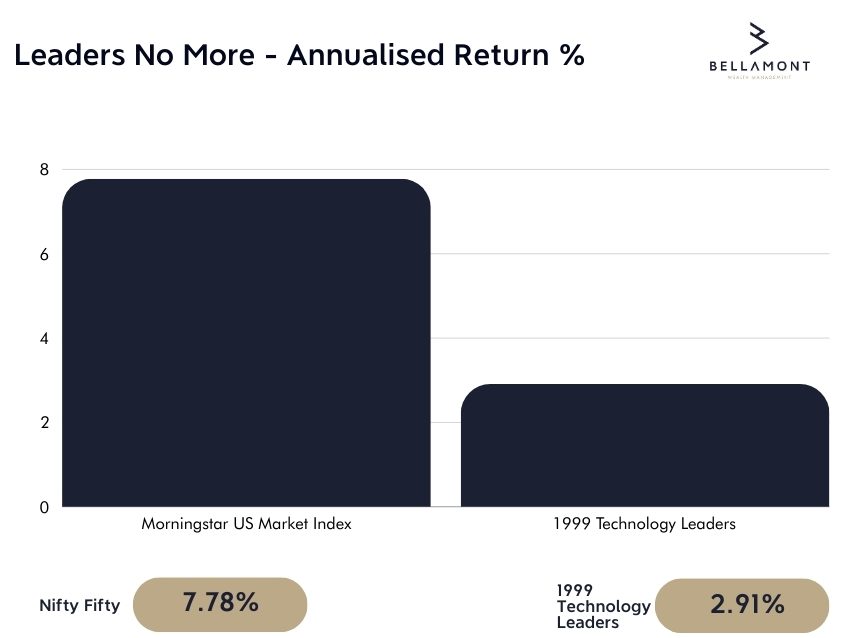
In contrast, 1999′s technology stock contenders stood a chance. They were a small group, occupying only the expanding technology and telecommunications sectors. Unfortunately, they contained too many failures and not enough long-term winners. Most notably AOL and Lucent imploded. Not much better were Cisco and IBM, which posted lower net incomes in 2023 than they had 24 years earlier, in 1999. Among those companies, only Microsoft has meaningfully outgained the Morningstar US Market Index since the new millennium began. One was not nearly enough.
Source: Morningstar Direct. Data as at 31 December 2023
Then came the best performance by glamour stocks. Unlike their predecessors, the FANG stocks have enjoyed great operating success. In just over a decade, they have grown their collective revenue ninefold and their earnings elevenfold. With those outstanding fundamental results, their initial prices became beside the point. They were bound to post terrific stock market returns.
CONCLUSION
Neither the Nifty Fifty nor the FANG stocks can serve as useful comparisons for the Magnificent Seven. The Nifty Fifty represented the destiny of the overall US industry, whereas the Magnificent Seven are, although extremely large, a specific branch of the economy. And the FANG stocks were in a different position entirely. In 2013, their businesses were much smaller and newer than are today’s Magnificent Seven. Their growth potential was therefore materially higher.
The experience of the new millennium’s leaders, though, provides a useful starting point for assessing the Magnificent Seven’s destiny. At the time, those new millennium businesses were similarly prized by investors, and they occupied what were then regarded as similarly exciting, cutting-edge industries.
As we have seen, their subsequent returns were poor. However, the shortfall largely occurred for one reason, that does not seem applicable to the Magnificent Seven, and for another that is certainly not. Firstly, two of 1999′s companies soon caved, and it is hard to envision any of the Magnificent Seven suffering the same immediate fate. Secondly, the new millennium firms were far more expensive than their successors.
Mark Twain once said that “Prediction is difficult, particularly when it involves the future.”
The fortune of the Magnificent Seven is unknown and the greater the attention and returns achieved, the more difficult it will be not to be caught up in the frenzy. Ensuring alignment with an investment philosophy is critically important and assessing each of the Magnificent Seven on a case-by-case basis, as opposed to blindly allocating to them based upon belief in the ‘AI revolution’, will help safeguard a portfolio. Our managers believe that the best outcome for investors will be achieved by investing in quality companies that can compound over time and have a degree of predictability in their earnings. These qualities will help navigate portfolios through the booms and busts of market cycles and avoid the negatively skewed outcomes witnessed by glamour stocks in the past.
